Access quarterly data and market insights showcasing the US smartphone market share, spanning from Q1 2018.
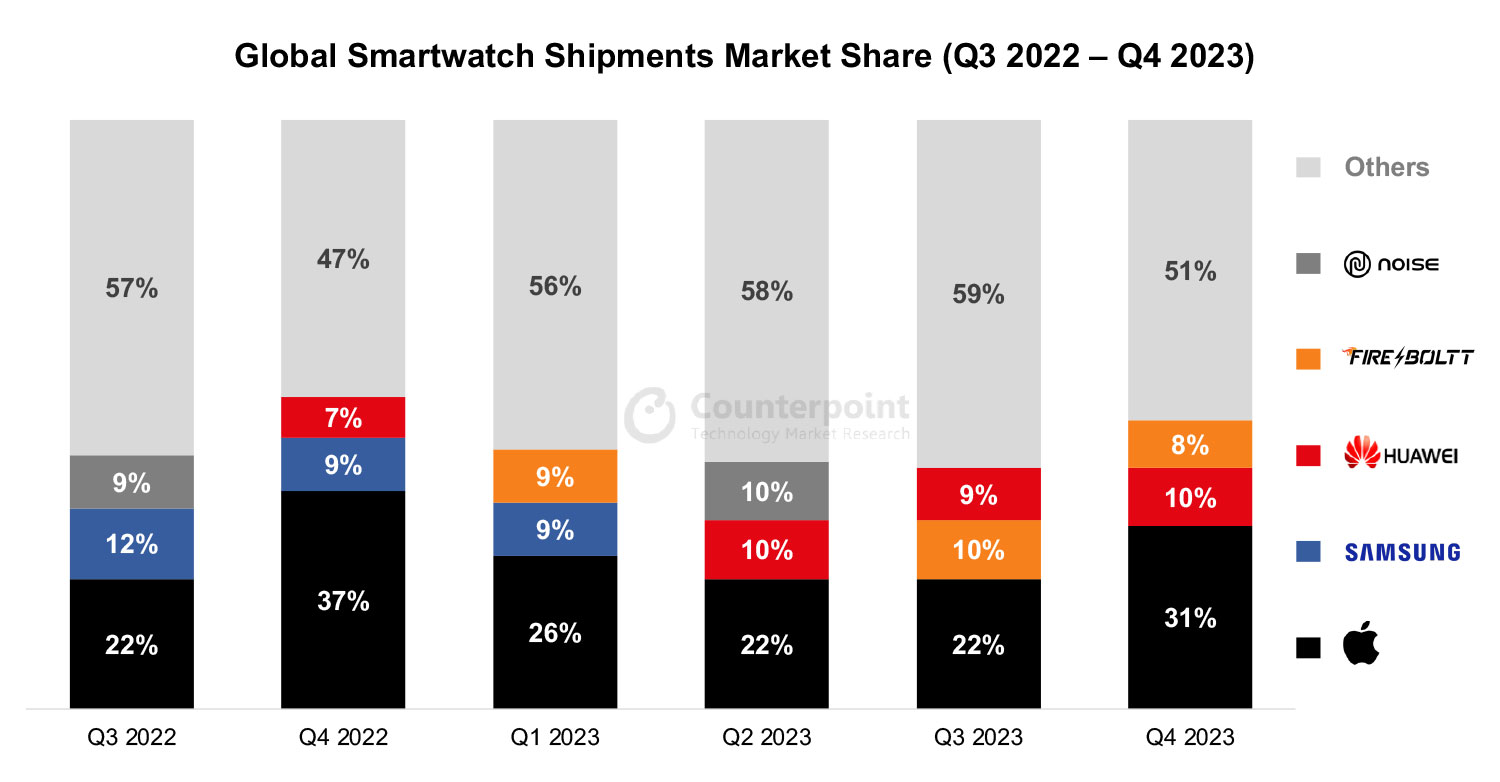
US Smartphone Shipments Market Data (Q3 2022 – Q4 2023)
Published Date: Feb 21, 2023
-
Market Highlights
-
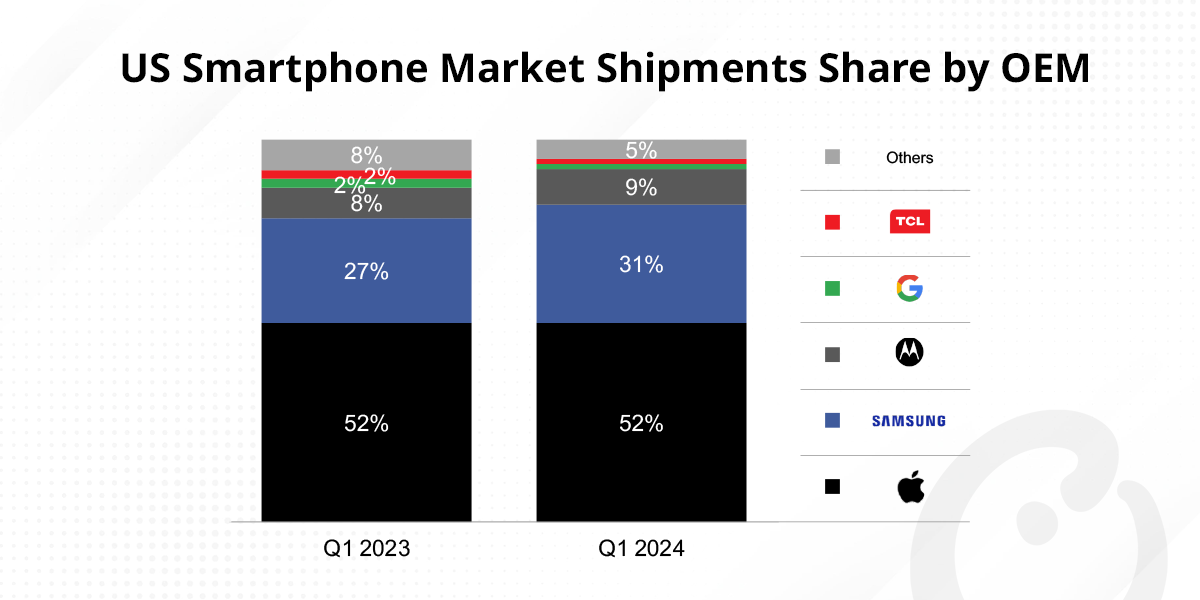
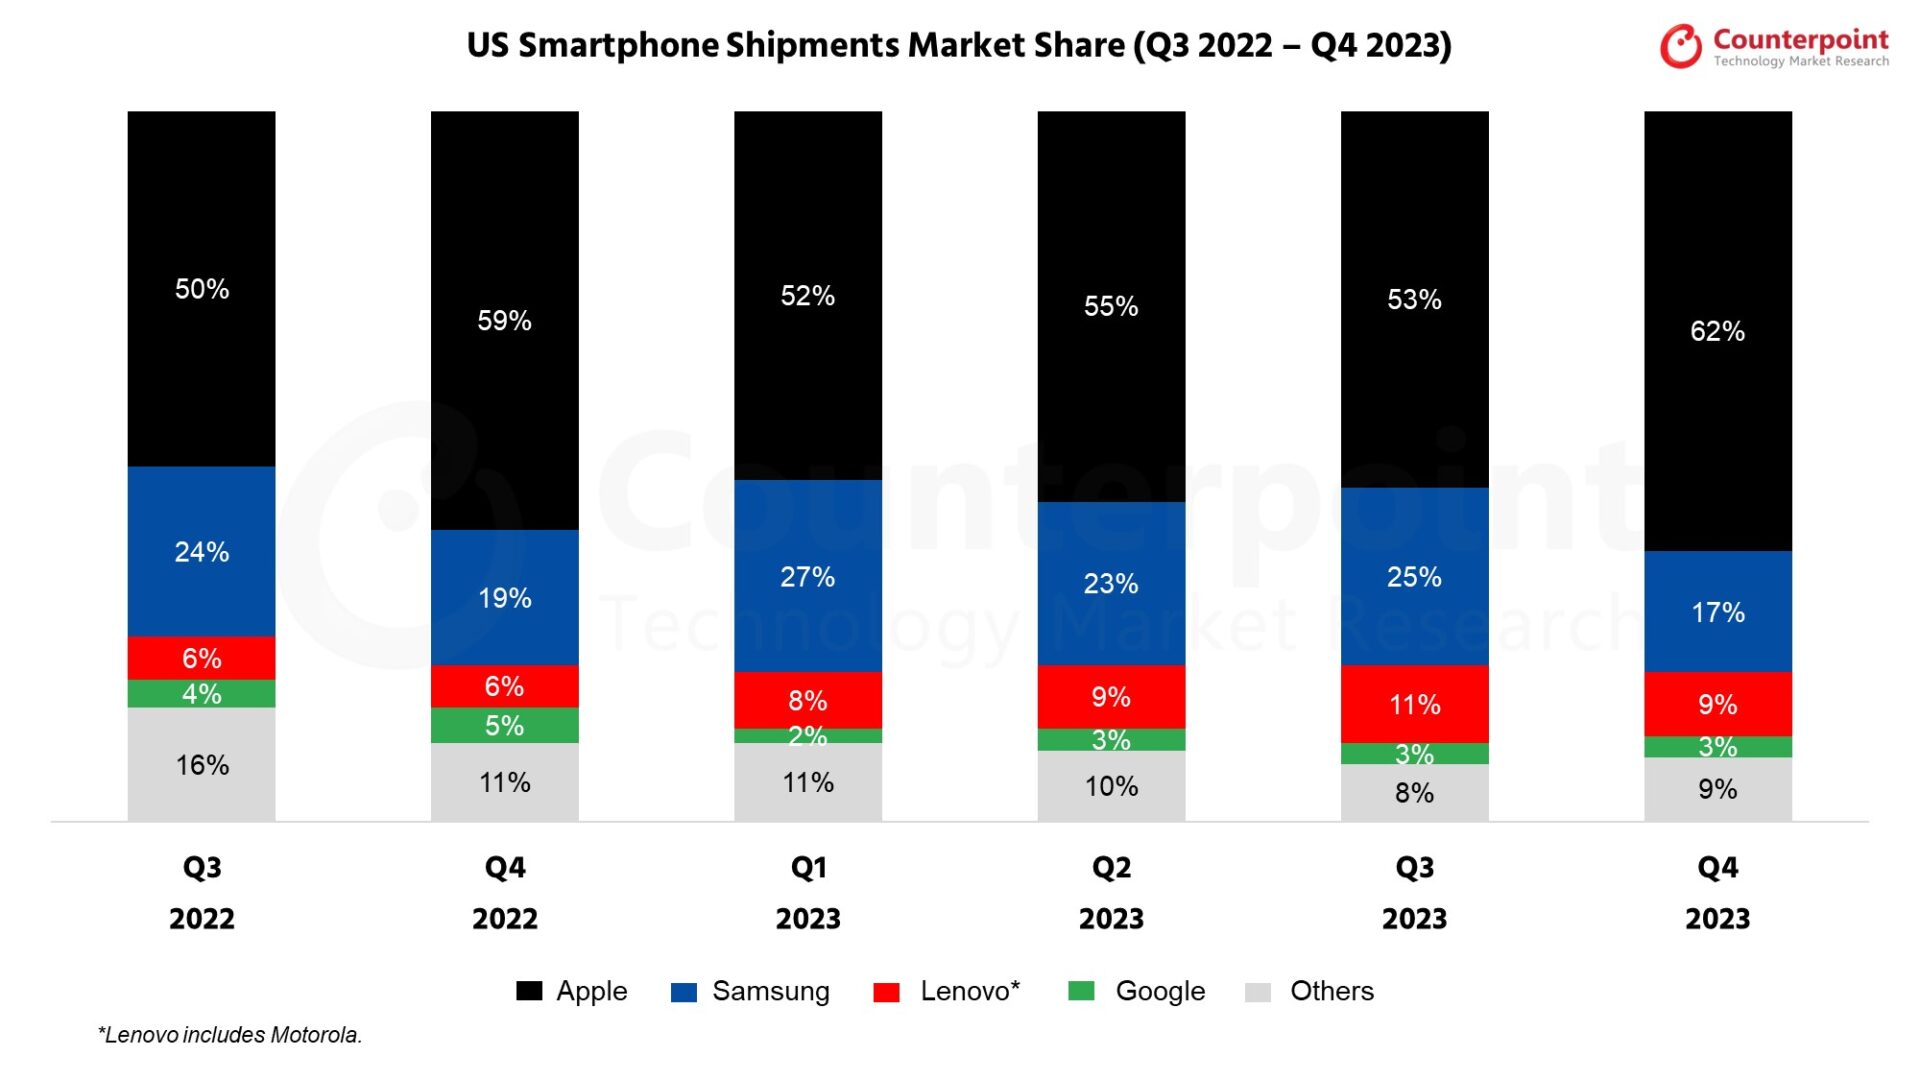
US Smartphone Shipments Market Share (%)
• US smartphone shipments declined YoY for the fifth straight quarter in Q4 2023 despite end-of-year holiday demand. Carriers continued to cite weak upgrade rates and long holding periods as reasons for the underperformance.
• Apple’s shipment share grew to 62% in Q4 as the OEM was less impacted by weak market dynamics due to the iPhone 15 launch in September.
• Samsung’s share declined YoY to 17%. It saw increased shipments due to the S24 launch in late January but low-end A-series shipments declined.
• Motorola’s share grew, partially due to some increases in premium devices, especially the RAZR 2023.
• Google’s share declined to 3% as Pixel sales were weaker YoY.
• In “others”, Nokia HMD continued to gain share due to a stronger channel presence in prepaid.
Click here to read about the US smartphone market in Q4 2023.
| Brands | Q3 2022 | Q4 2022 | Q1 2023 | Q2 2023 | Q3 2023 | Q4 2023 |
|---|---|---|---|---|---|---|
| Apple | 50% | 59% | 52% | 55% | 53% | 62% |
| Samsung | 24% | 19% | 27% | 23% | 25% | 17% |
| Motorola | 6% | 6% | 8% | 9% | 11% | 9% |
| 4% | 5% | 2% | 3% | 3% | 3% | |
| Others | 16% | 11% | 11% | 10% | 8% | 9% |
*Lenovo includes Motorola.
**Ranking is according to the latest quarter.
Data on this page is updated every quarter
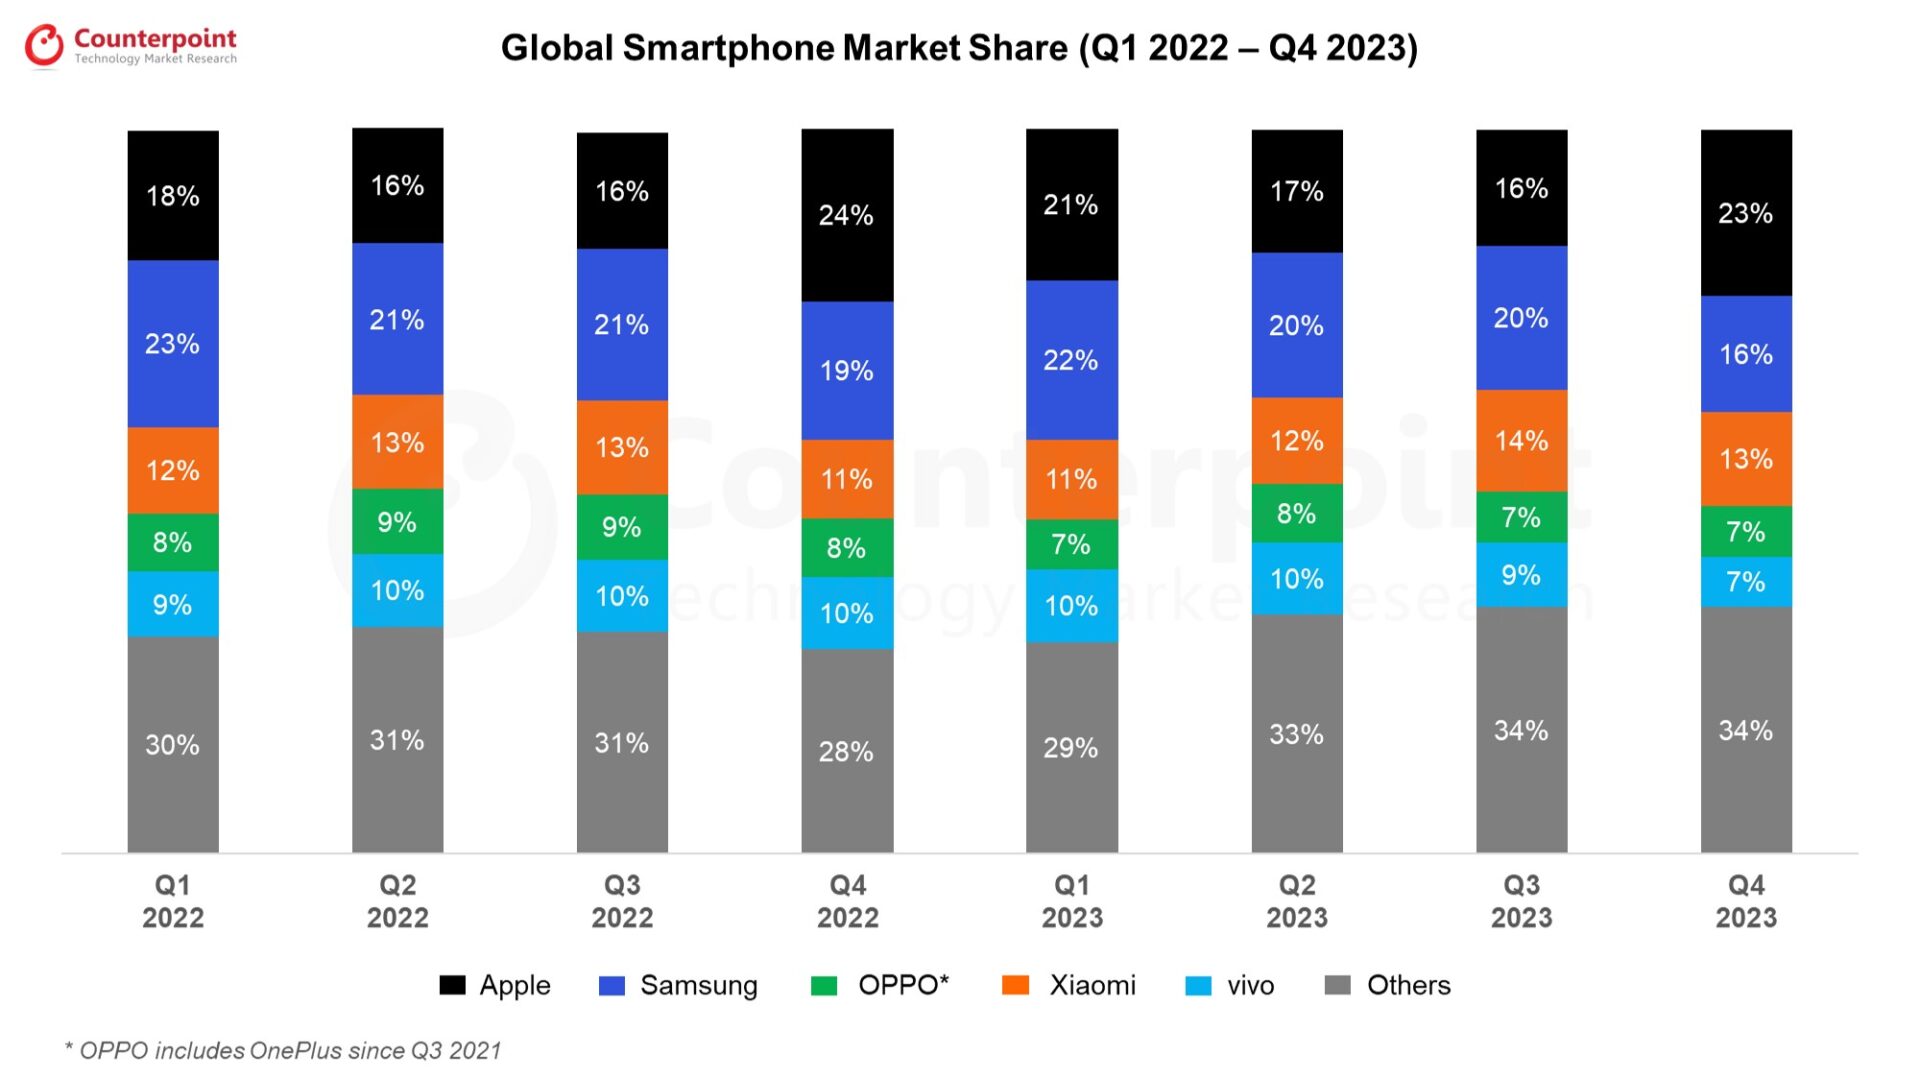
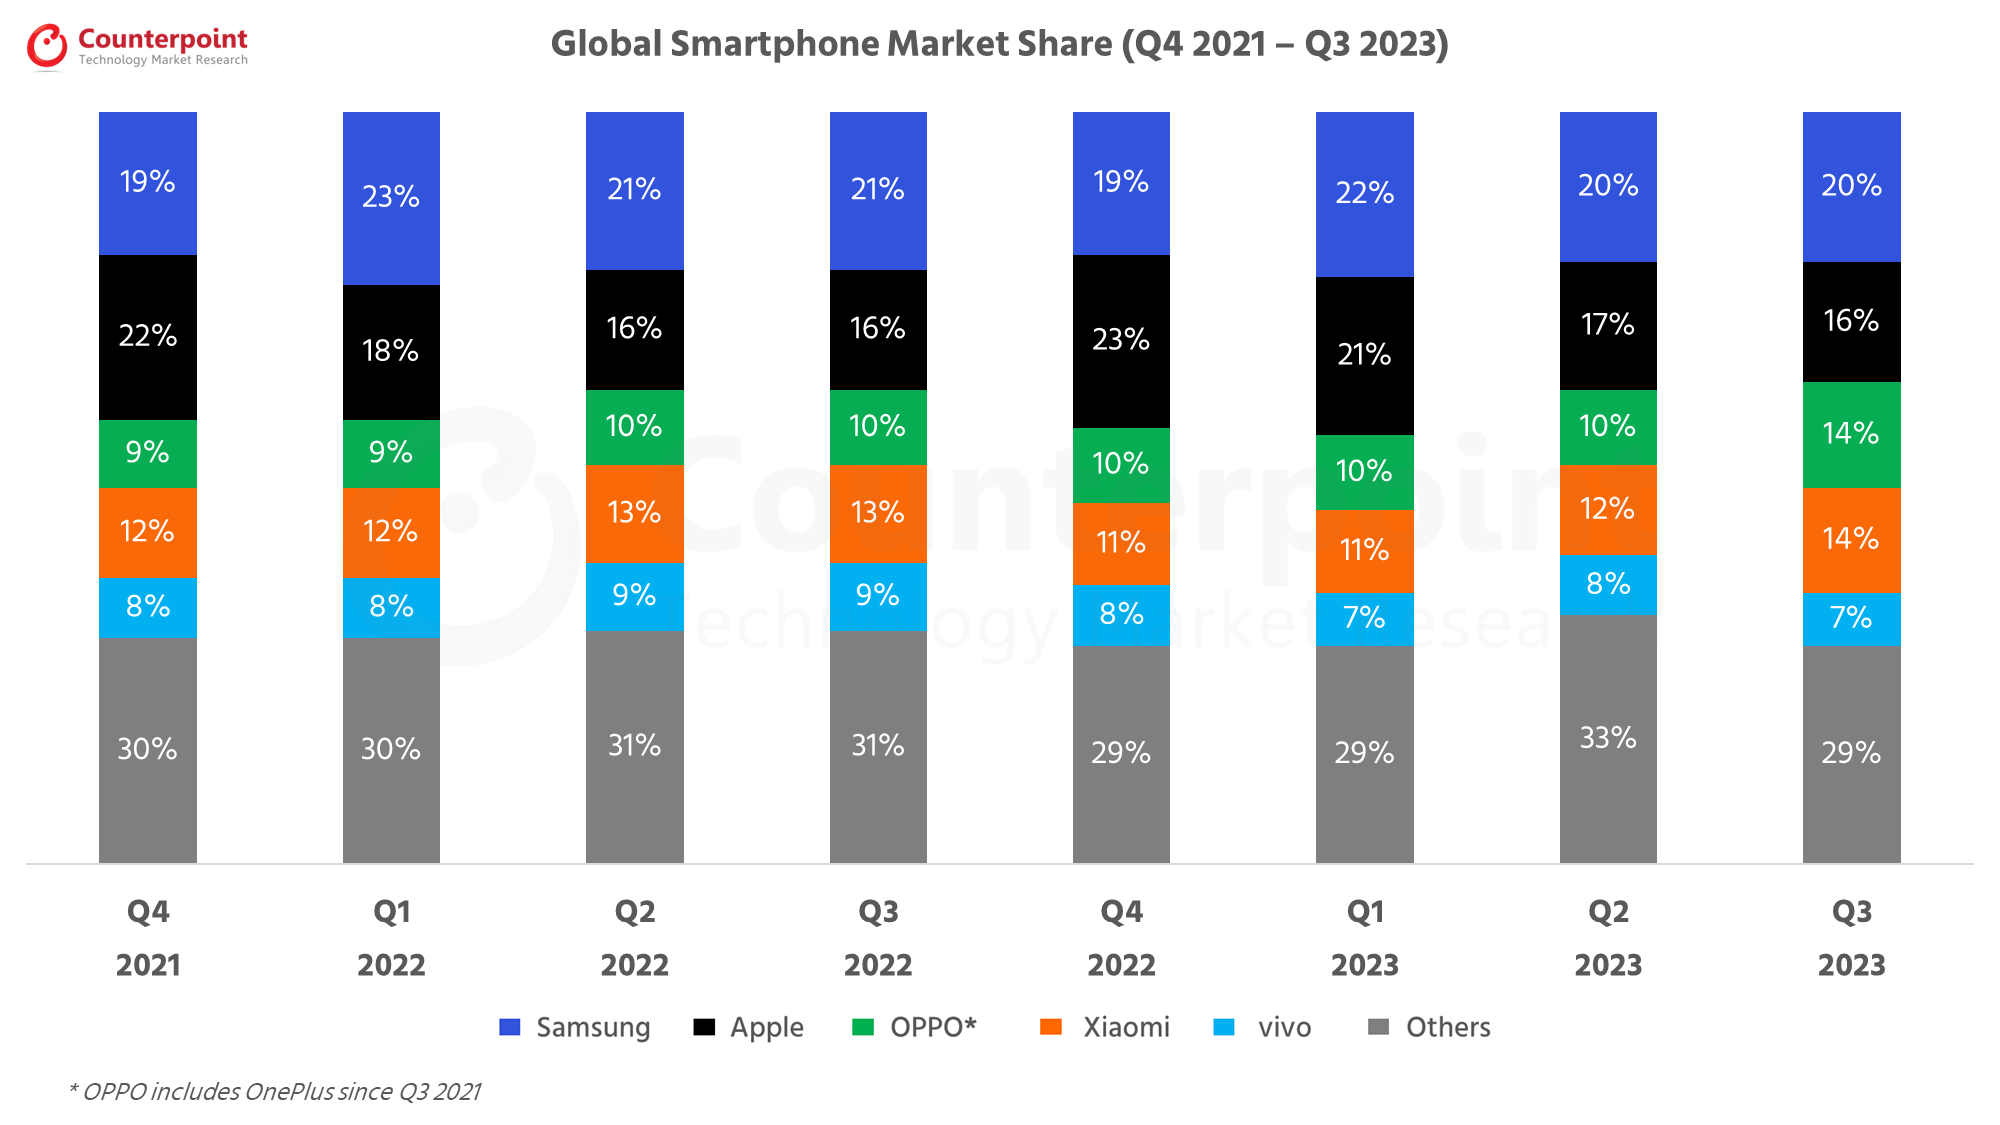
This data represents the global smartphone market share by quarter (from 2021-2023) by top OEMs. Global smartphone shipments by market share and millions of units are provided.
For detailed insights on the data, please reach out to us at sales(at)counterpointresearch.com. If you are a member of the press, please contact us at press(at)counterpointresearch.com for any media enquiries.
The global smartphone market share numbers are from:
MOBILE DEVICES MONITOR – Q4 2023 (Vendor Region Countries)
Excel File
Published Date: November 2023
This report is part of a series of reports which track the mobile handset market: Smartphone and Feature Phone shipments every quarter for more than 140 brands covering more than 95% of the total device shipments in the industry.
Recommended Reads:


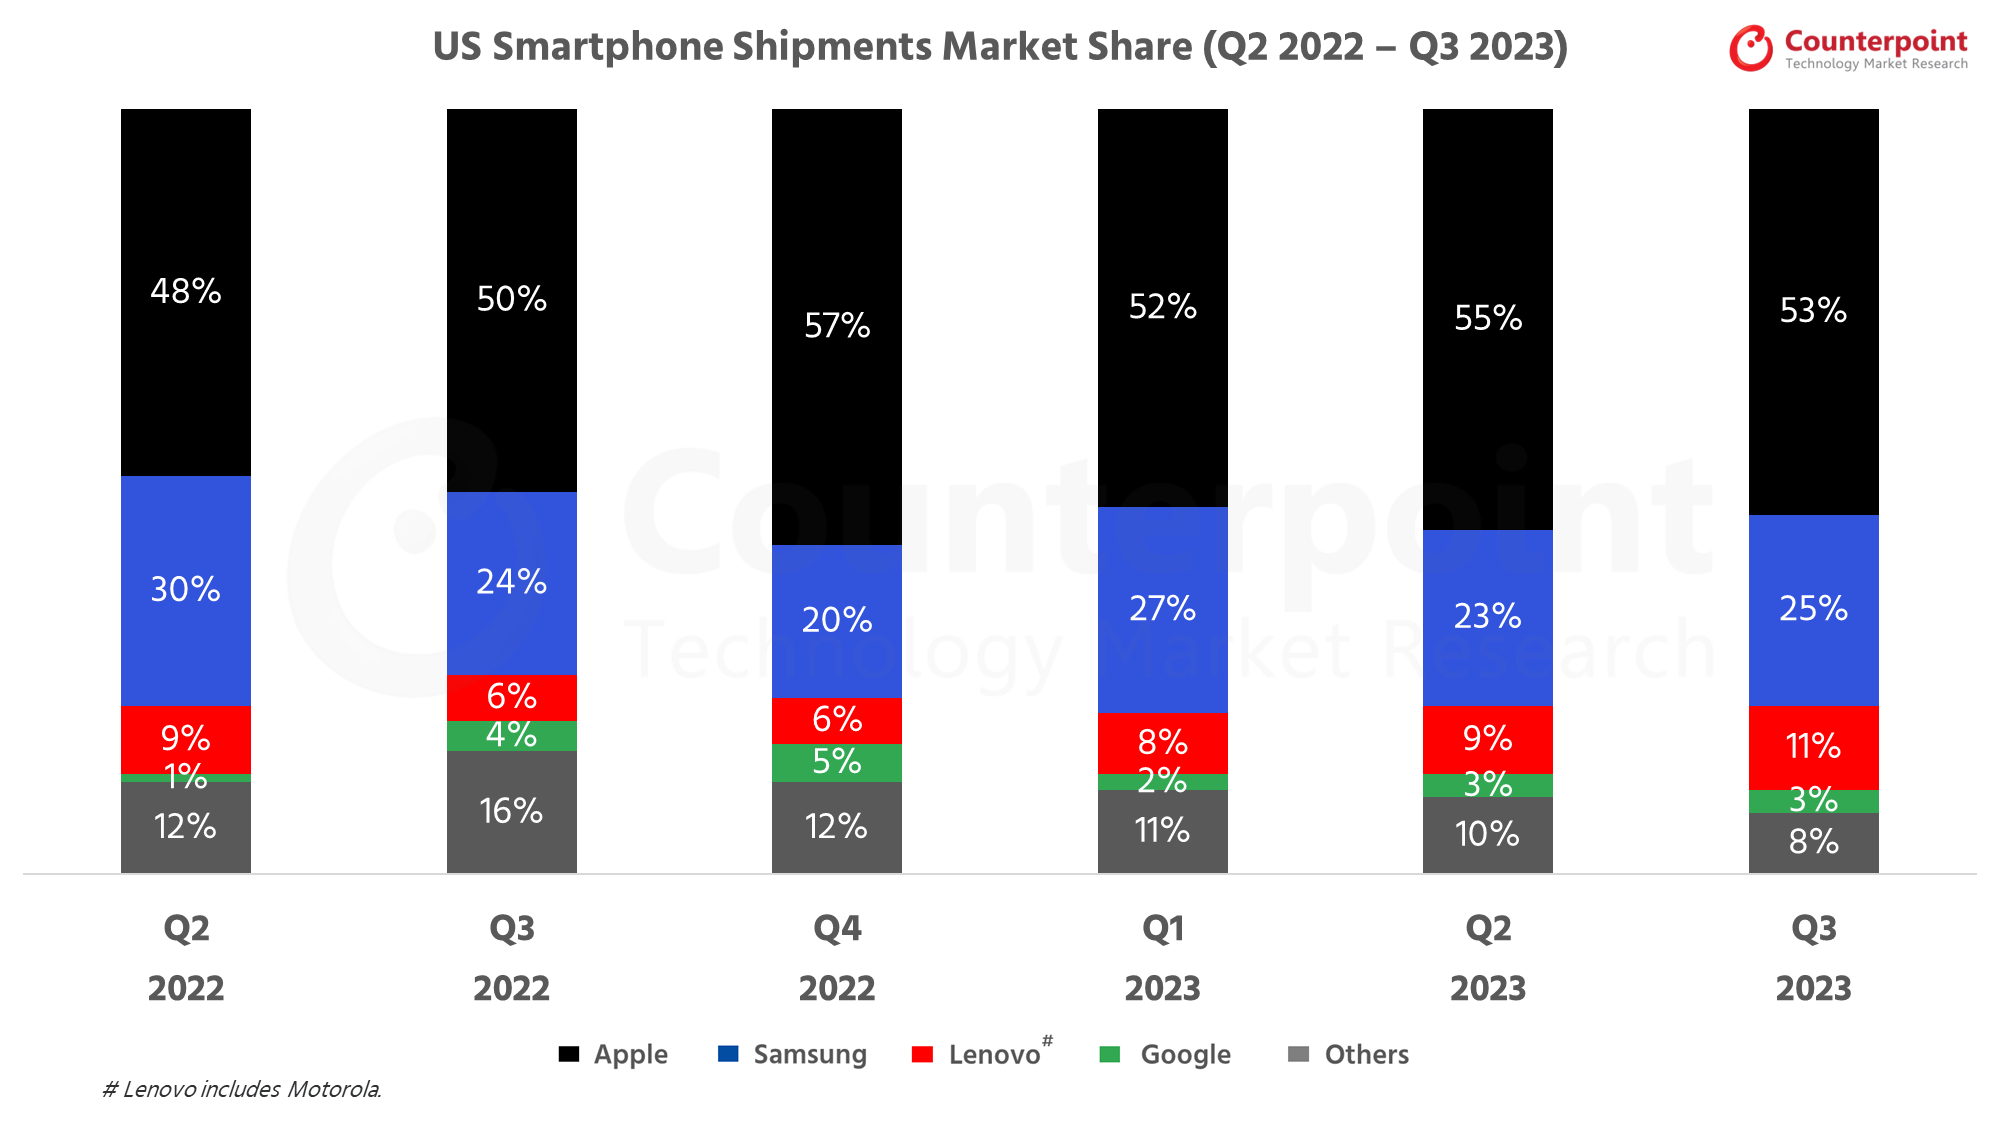
US Smartphone Shipments Market Data (Q2 2022 – Q3 2023)
Published Date: Nov 27, 2023
-
Market Highlights
-
US Smartphone Shipments Market Share (%)
• US smartphone shipments declined YoY for the fourth straight quarter in Q3 2023 amid weak consumer demand.
• Google, Samsung and TCL were among the brands recording the steepest YoY declines, while Motorola and Nokia HMD managed growth amid a challenging market environment. Motorola increased its shipment share to 11% in Q3.
• Apple’s iPhone shipments declined 11% YoY, in part due to the later launch date of the iPhone 15 series compared to the iPhone 14 series. Its sales share dropped to 53% in Q3 from 55% in Q2.
• Weak upgrade rates at the carriers were the main source of weak smartphone shipments, signaling that consumers are opting to hold on to their devices for longer.
| Brands | Q2 2022 | Q3 2022 | Q4 2022 | Q1 2023 | Q2 2023 | Q3 2023 |
|---|---|---|---|---|---|---|
| Apple | 48% | 50% | 57% | 52% | 55% | 53% |
| Samsung | 30% | 24% | 20% | 27% | 23% | 25% |
| Lenovo# | 9% | 6% | 6% | 8% | 9% | 11% |
| 1% | 4% | 5% | 2% | 3% | 3% | |
| Others | 12% | 16% | 12% | 11% | 10% | 8% |
#Lenovo includes Motorola.
**Ranking is according to the latest quarter.
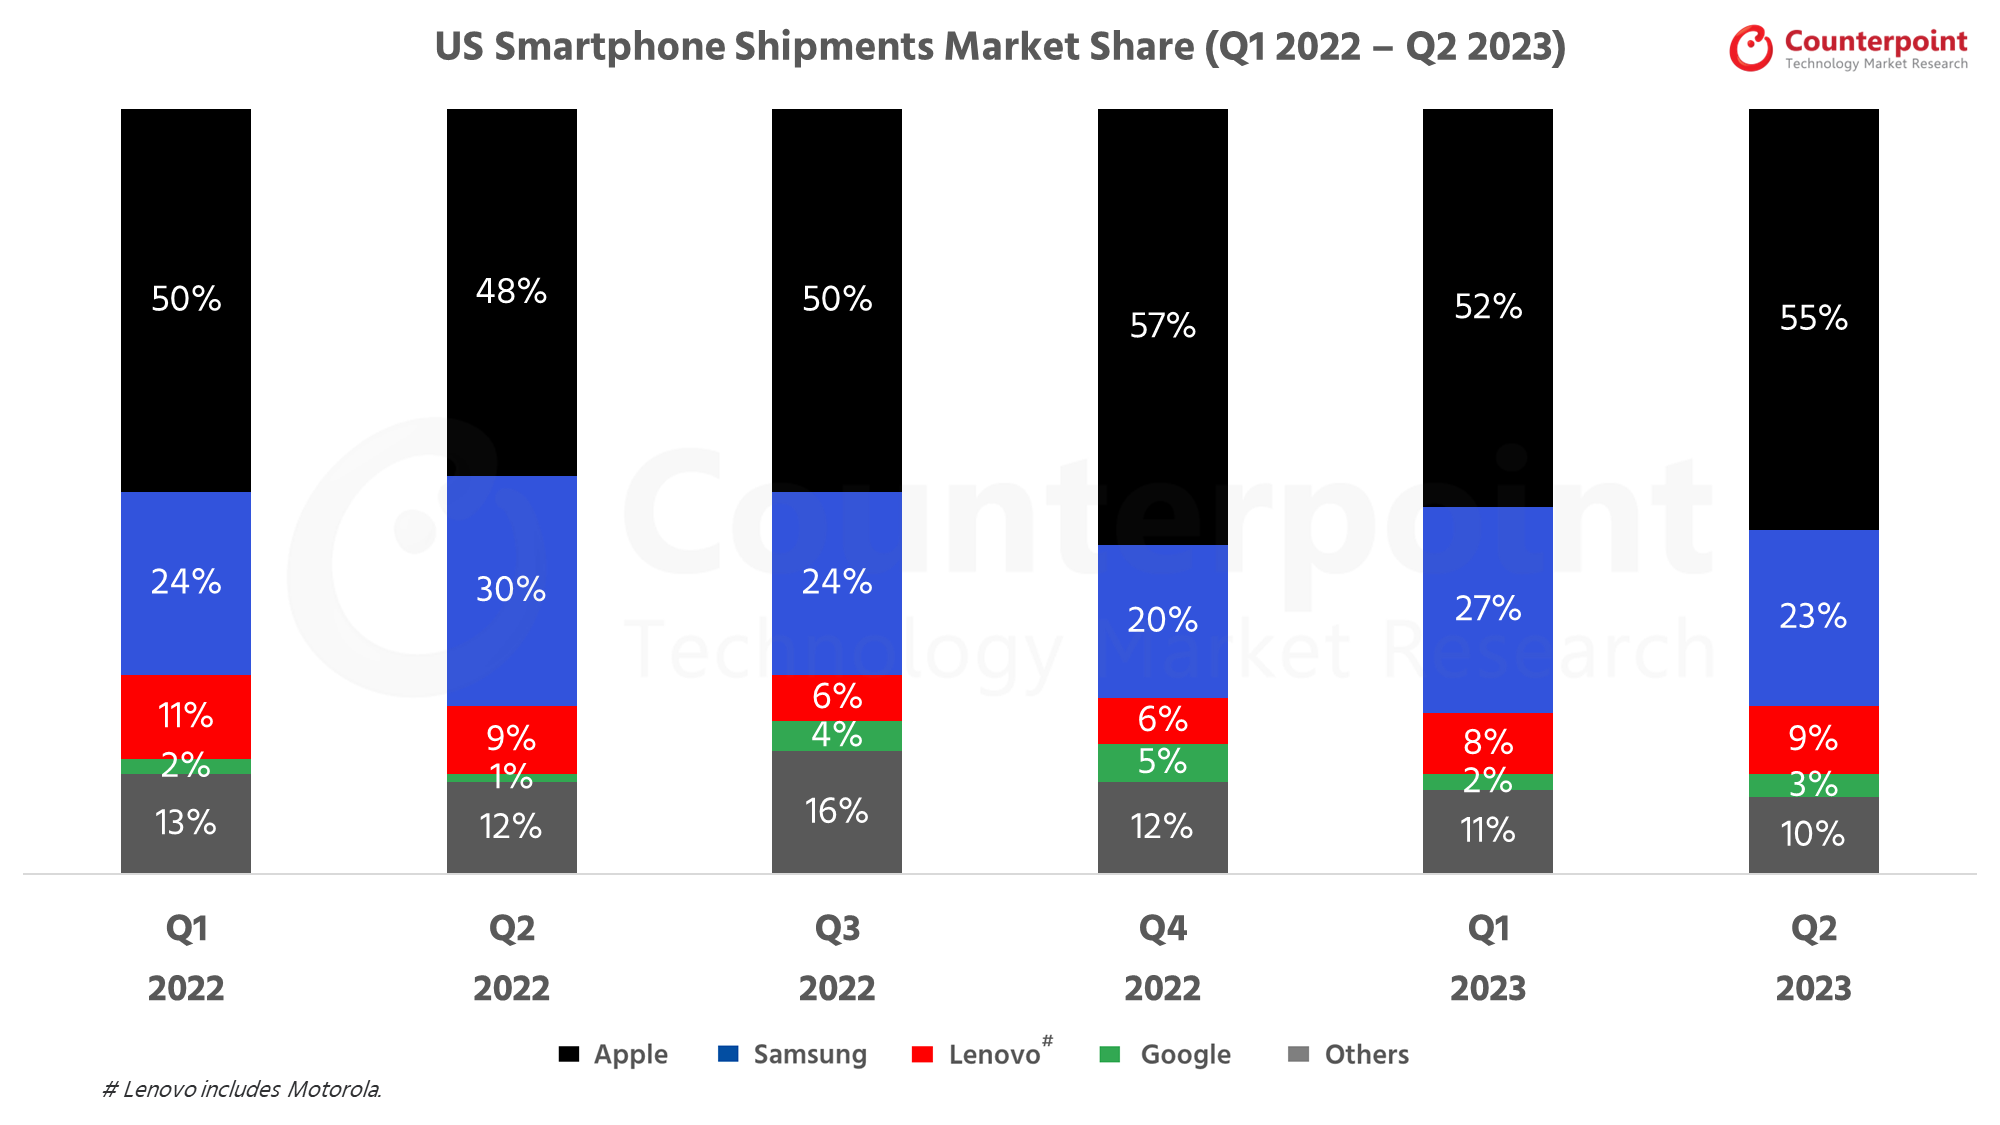
US Smartphone Shipments Market Data (Q1 2022 – Q2 2023)
Published Date: Aug 17, 2023
-
Market Highlights
-
US Smartphone Shipments Market Share (%)
• US smartphone shipments declined 24% YoY. Low-end smartphone sale declines were the biggest contributing factor to the downturn.
• Samsung’s shares dropped to 23% as competition from other Android OEMs has increased in the prepaid segment, hurt Samsung’s performance.
• Apple was one of the few OEMs that did not see a shipments drop of double digits YoY. Older iPhone 11 and iPhone 12 devices are helping the OEM attract new customers.
• Google’s share rose to 3% due to the earlier launch of the Pixel 7a compared to its predecessor.
• Motorola grew to 9% share capitalizing on Samsung’s weakness, launching new devices including the G Stylus, G 5G and the new Razr+ in Q2.
| Brands | Q1 2022 | Q2 2022 | Q3 2022 | Q4 2022 | Q1 2023 | Q2 2023 |
|---|---|---|---|---|---|---|
| Apple | 50% | 48% | 50% | 57% | 52% | 55% |
| Samsung | 24% | 30% | 24% | 20% | 27% | 23% |
| Lenovo# | 11% | 9% | 6% | 6% | 8% | 9% |
| 2% | 1% | 4% | 5% | 2% | 3% | |
| Others | 13% | 12% | 16% | 12% | 11% | 10% |
#Lenovo includes Motorola.
**Ranking is according to the latest quarter.
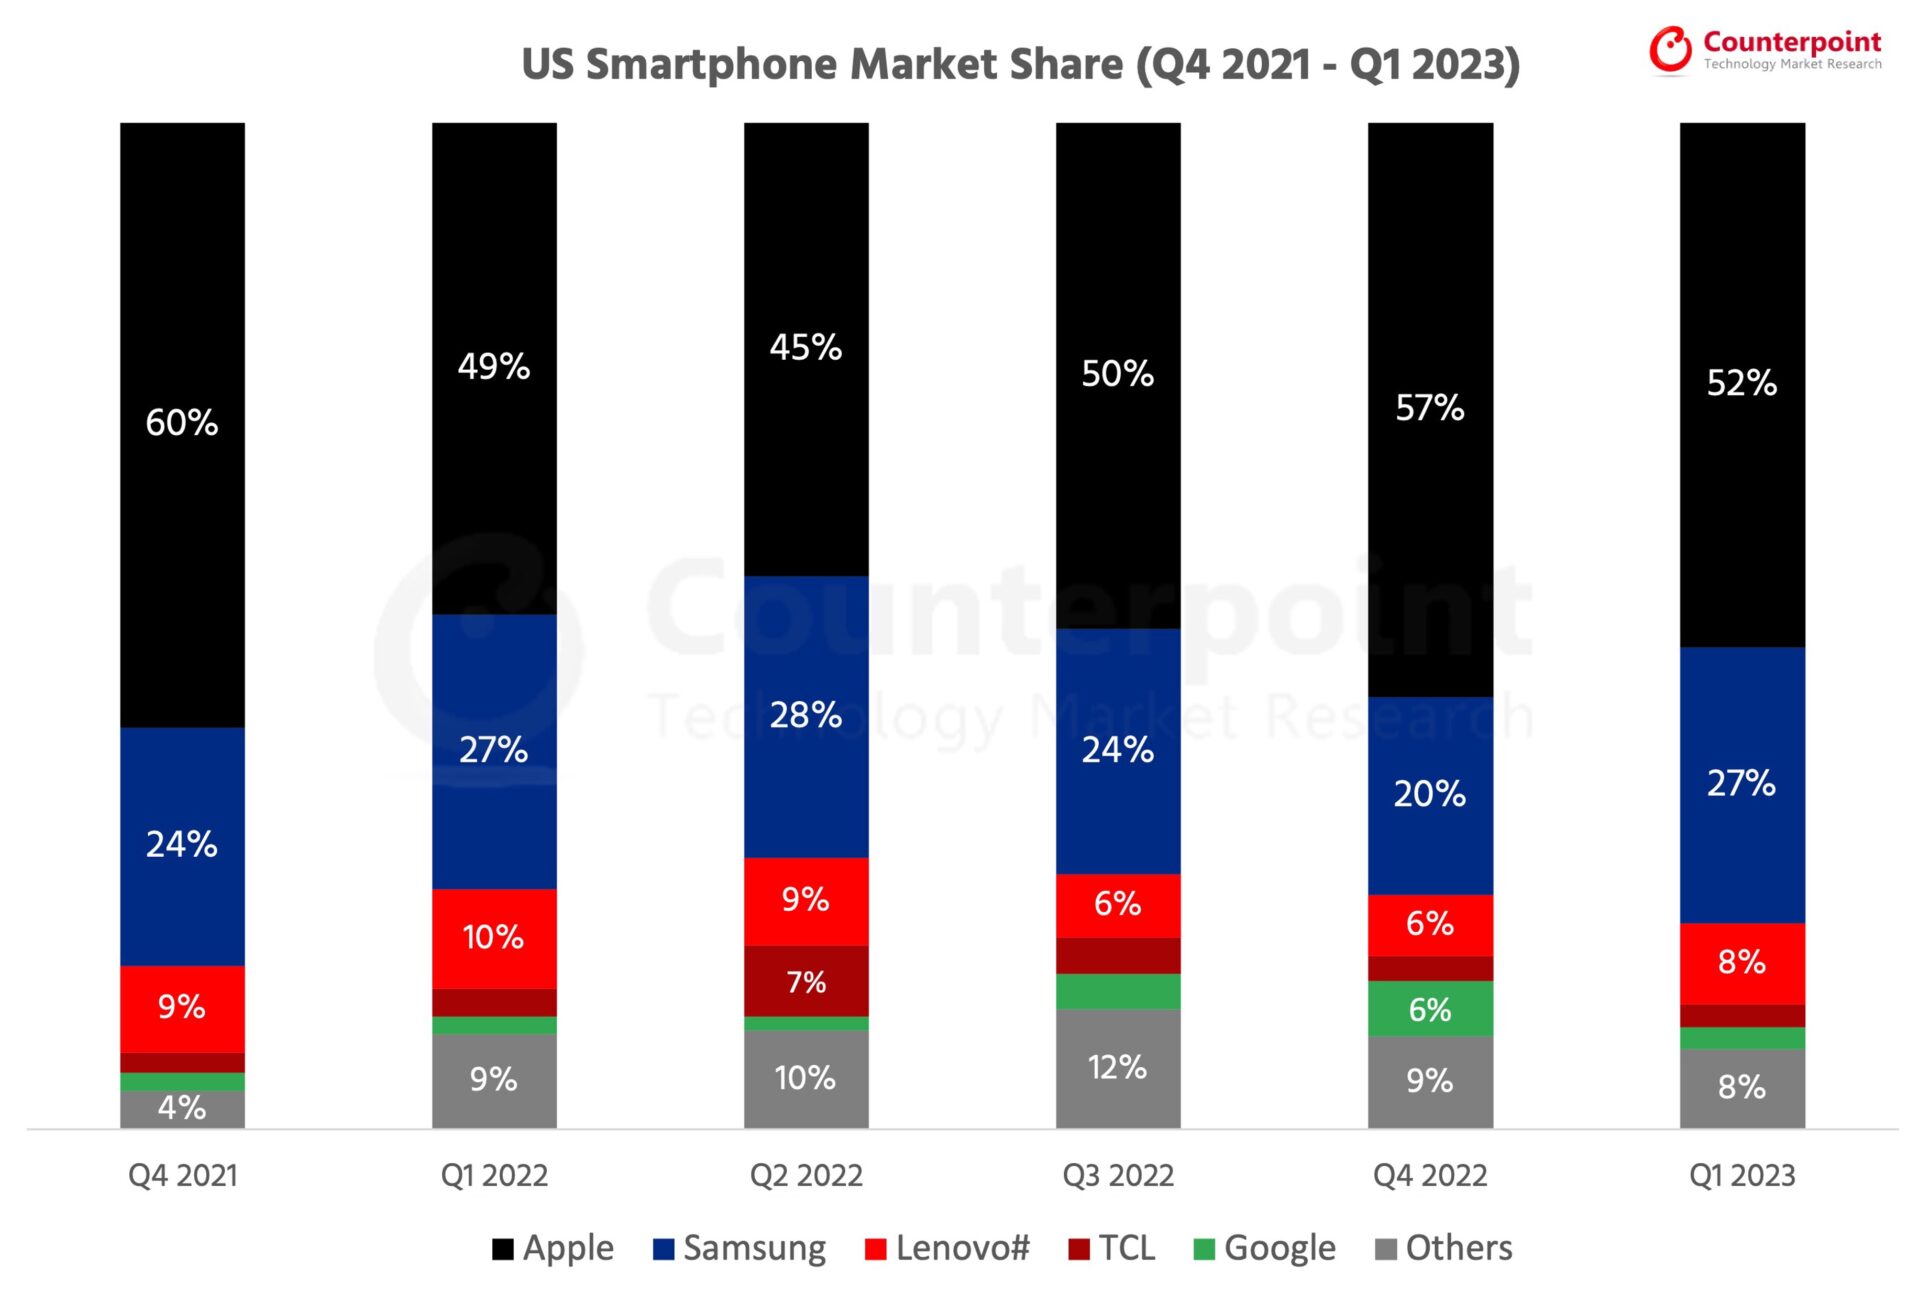
US Smartphone Shipments Market Data (Q4 2021 – Q1 2023)
-
Market Highlights
-
US Smartphone Shipments Market Share (%)
• US smartphone shipments declined 17% YoY in Q1 2023 due to inventory correction and weak consumer demand.
• Apple market share increased to 52% in Q1 2023 from 49% in Q1 2022 as it began aggressively selling iPhone 11 in prepaid channels.
• Samsung Galaxy S23 shipments were up double digits YoY while the Galaxy A14 5G performed exceptionally well in prepaid resulting in 27% share of shipments.
• Lenovo Group (Motorola) and TCL Group saw shipments decline in Q1 but their overall shipment share grew as OEMs like Nokia HMD and white-label devices saw even steeper declines.
• During Q1 2023, carriers reported very low upgrades. We expect the incumbent postpaid players to increase promotional activity during the second half of the year to combat cable MVNOs, which saw higher net additions than the Big 3 during the quarter, a first for the US smartphone market.
| Brands | Q4 2021 | Q1 2022 | Q2 2022 | Q3 2022 | Q4 2022 | Q1 2023 |
|---|---|---|---|---|---|---|
| Apple | 60% | 49% | 45% | 50% | 57% | 52% |
| Samsung | 24% | 27% | 28% | 24% | 20% | 27% |
| Lenovo# | 9% | 10% | 9% | 6% | 6% | 8% |
| TCL | 2% | 3% | 7% | 4% | 3% | 2% |
| 2% | 2% | 1% | 4% | 6% | 2% | |
| Others | 4% | 9% | 10% | 12% | 9% | 8% |
#Lenovo includes Motorola.
**Ranking is according to the latest quarter.
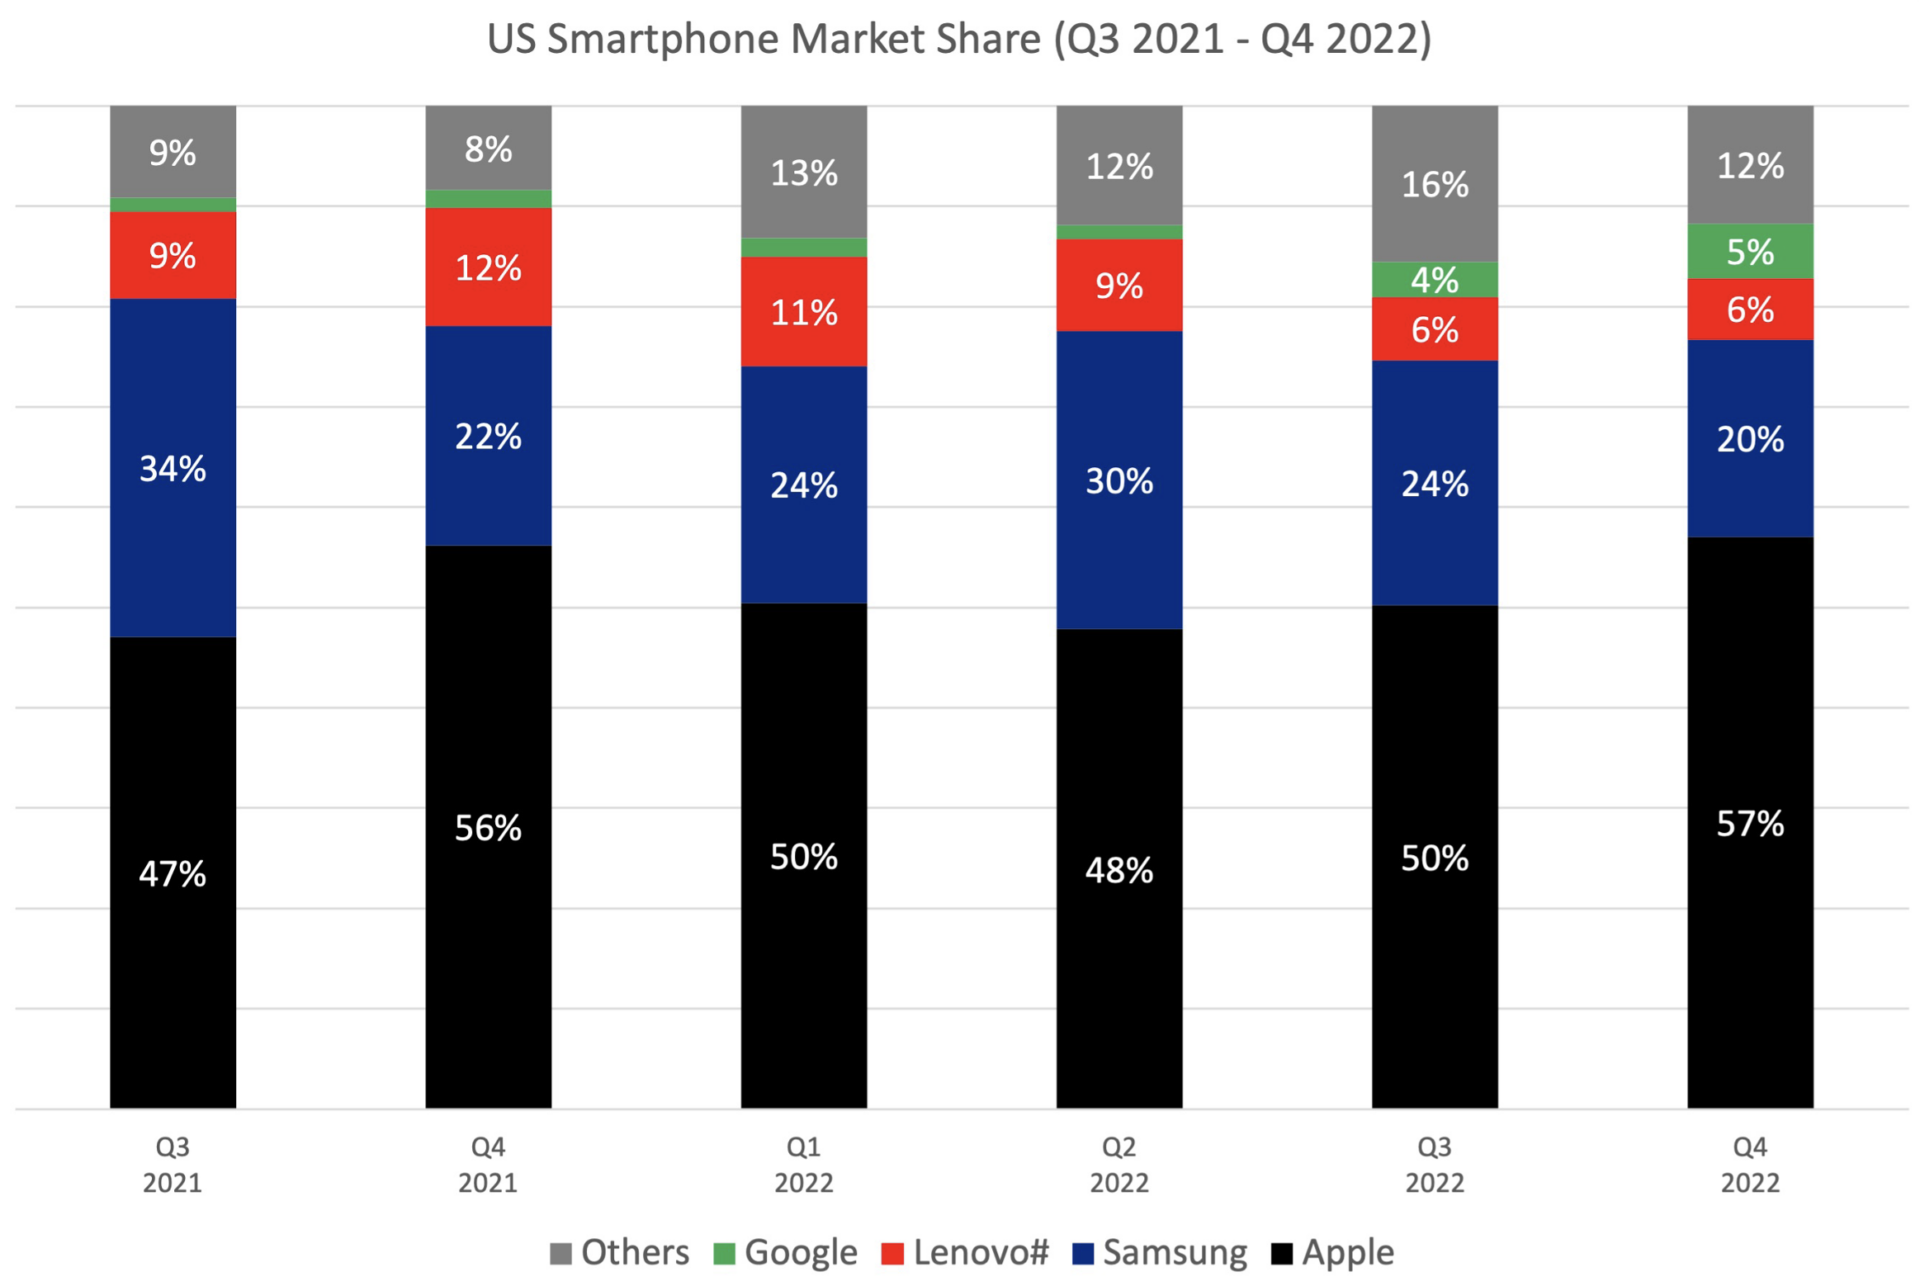
US Smartphone Shipments Market Data (Q3 2021 – Q4 2022)
-
US Smartphone Shipments Market Share (%)
| US Smartphone Market Share (%) | ||||||
| Brands | Q3 2021 | Q4 2021 | Q1 2022 | Q2 2022 | Q3 2022 | Q4 2022 |
| Others | 9% | 8% | 13% | 12% | 16% | 12% |
| 1% | 2% | 2% | 1% | 4% | 5% | |
| Lenovo# | 9% | 12% | 11% | 9% | 6% | 6% |
| Samsung | 34% | 22% | 24% | 30% | 24% | 20% |
| Apple | 47% | 56% | 50% | 48% | 50% | 57% |
#Lenovo includes Motorola.
**Ranking is according to the latest quarter.
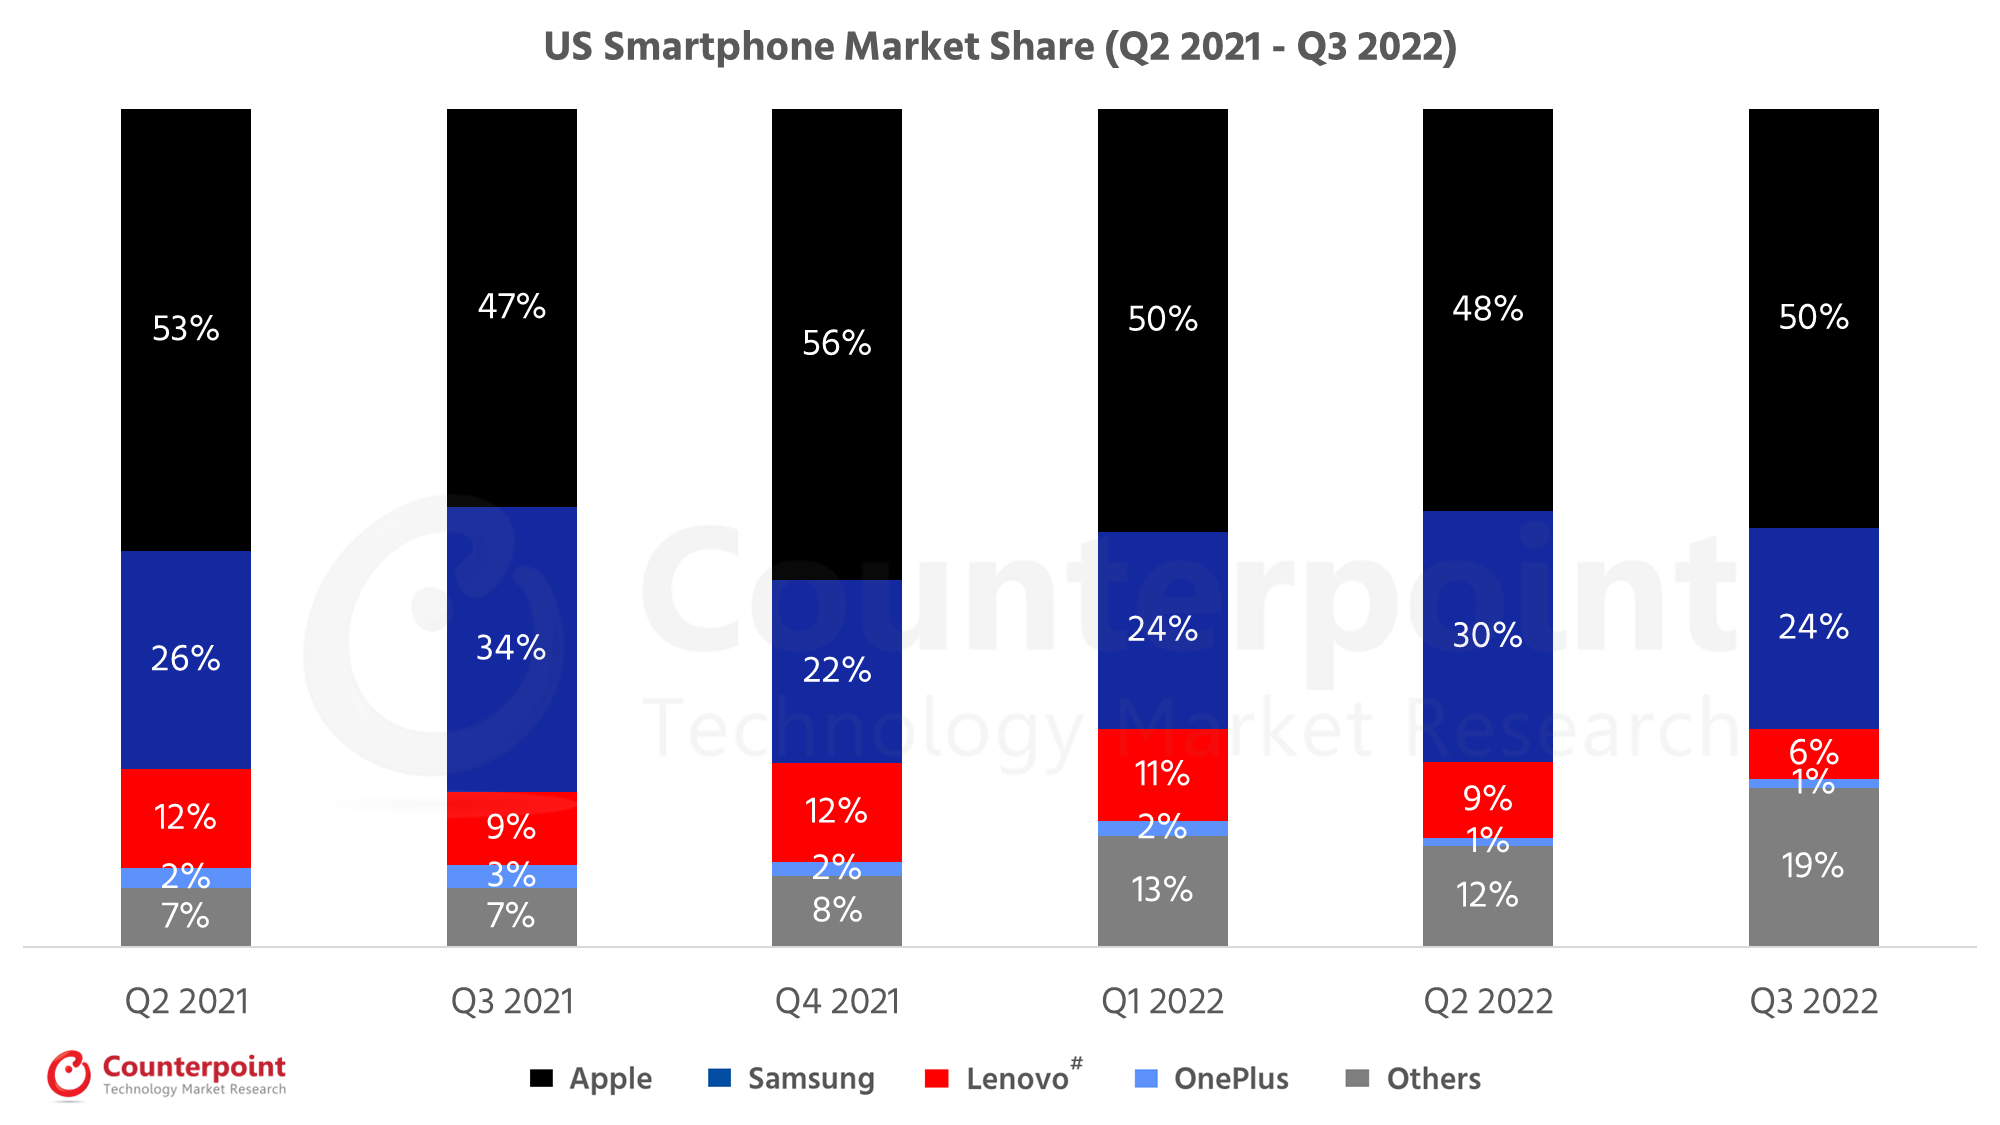
US Smartphone Shipments Market Data (Q2 2021 – Q3 2022)
-
US Smartphone Shipments Market Share (%)
| US Smartphone Market Share (%) | ||||||
| Brands | Q2 2021 | Q3 2021 | Q4 2021 | Q1 2022 | Q2 2022 | Q3 2022 |
| Apple | 53% | 47% | 56% | 50% | 48% | 50% |
| Samsung | 26% | 34% | 22% | 24% | 30% | 24% |
| Lenovo# | 12% | 9% | 12% | 11% | 9% | 6% |
| OnePlus | 2% | 3% | 2% | 2% | 1% | 1% |
| Others | 7% | 7% | 8% | 13% | 12% | 19% |
#Lenovo includes Motorola.
**Ranking is according to the latest quarter.
US Smartphone Shipments Market Data (Q1 2021 – Q2 2022)
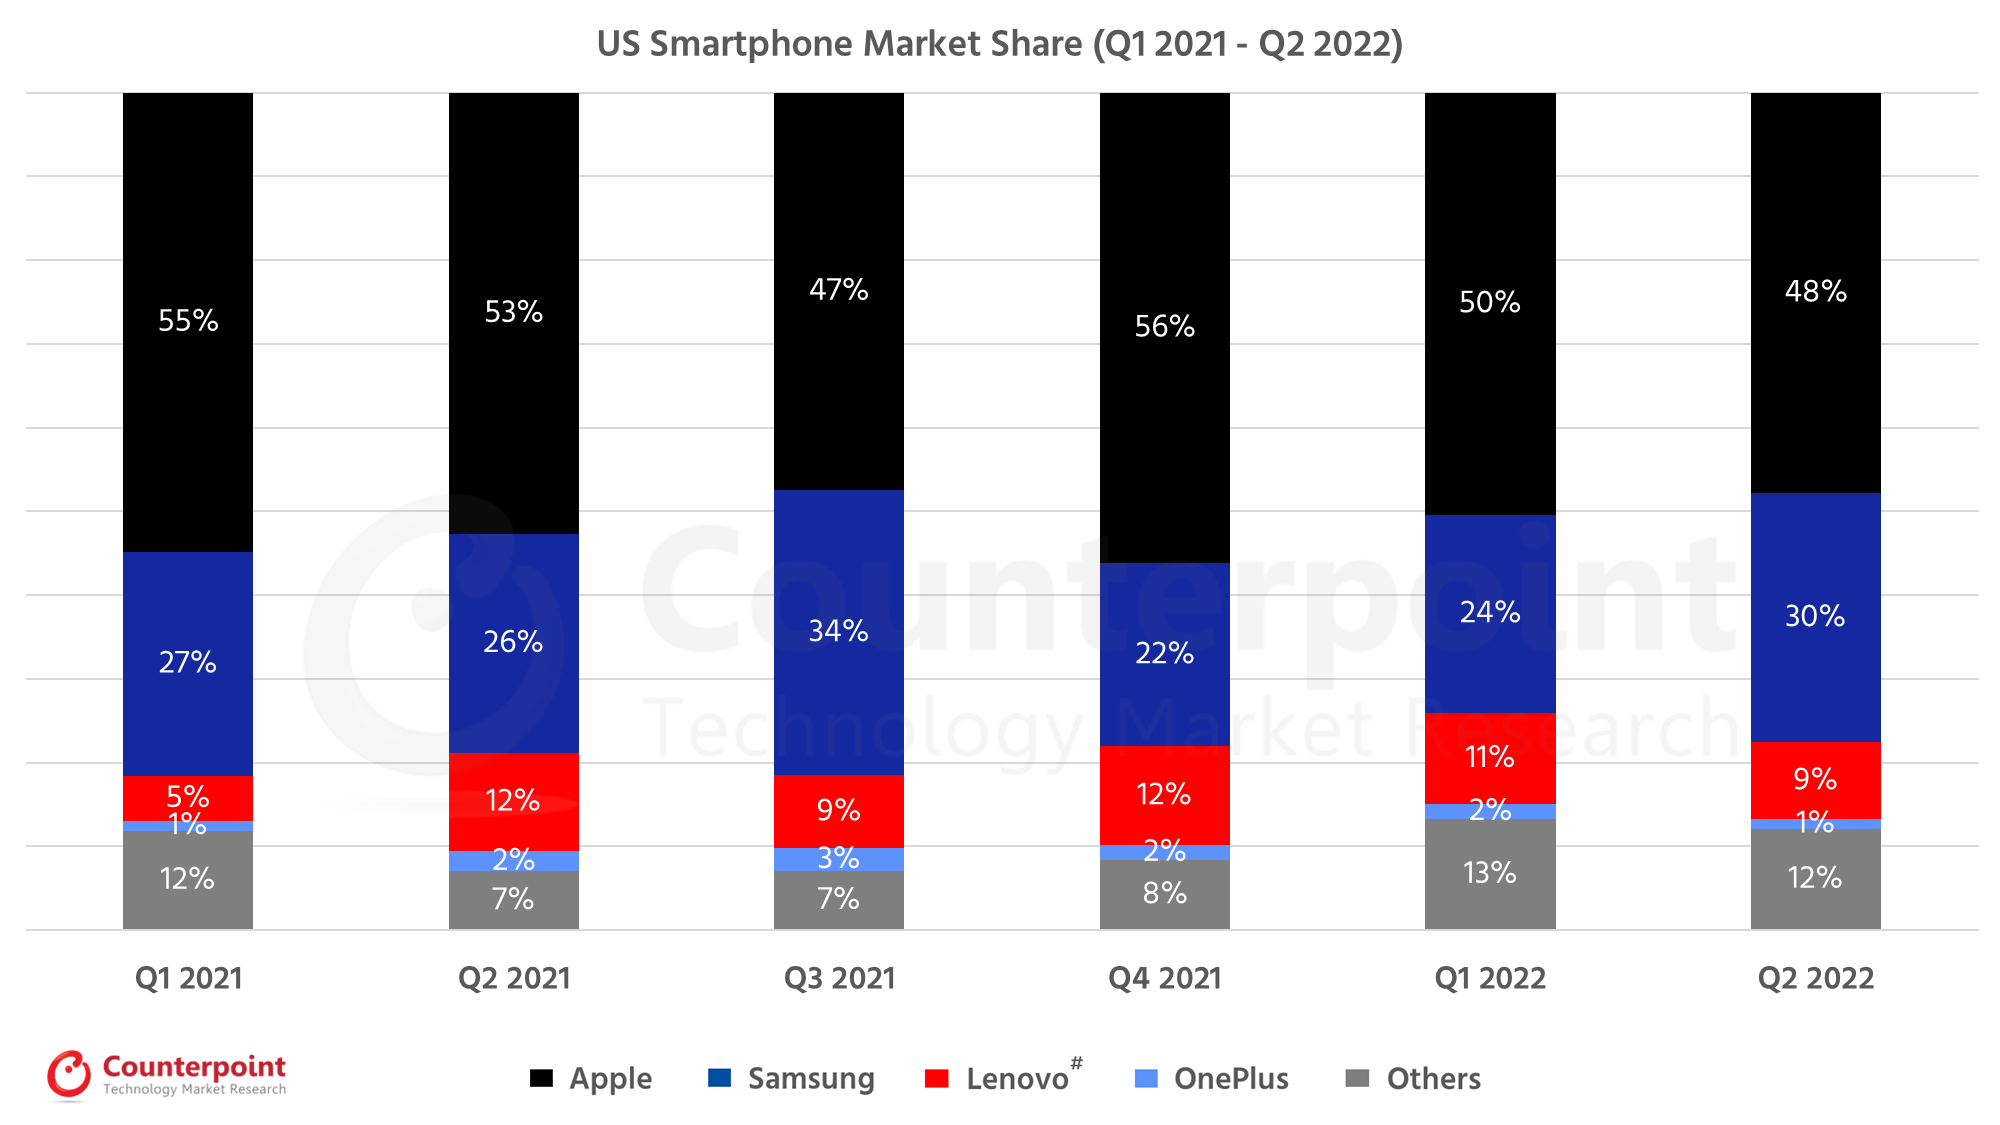
- Market Highlights
-
US Smartphone Shipments Market Share (%)
- Smartphone shipments declined 10% QoQ as market demand contracted due to economic headwinds.
- Apple declined 17% QoQ as iPhone 13 demand began to wane post iPhone launch season.
- Samsung declined 7% QoQ but increased its overall market share to 24% as the demand for the S22 series and A13 5G models remained robust.
- Lenovo (Motorola)'s market share declined slightly to 11%. Shipments declined as Motorola experienced inventory build-up.
| US Smartphone Market Share (%) | ||||||
| Brands | Q1 2021 | Q2 2021 | Q3 2021 | Q4 2021 | Q1 2022 | Q2 2022 |
| Apple | 55% | 53% | 47% | 56% | 50% | 48% |
| Samsung | 27% | 26% | 34% | 22% | 24% | 30% |
| Lenovo# | 5% | 12% | 9% | 12% | 11% | 9% |
| OnePlus | 1% | 2% | 3% | 2% | 2% | 1% |
| Others | 12% | 7% | 7% | 8% | 13% | 12% |
#Lenovo includes Motorola.
**Ranking is according to the latest quarter.
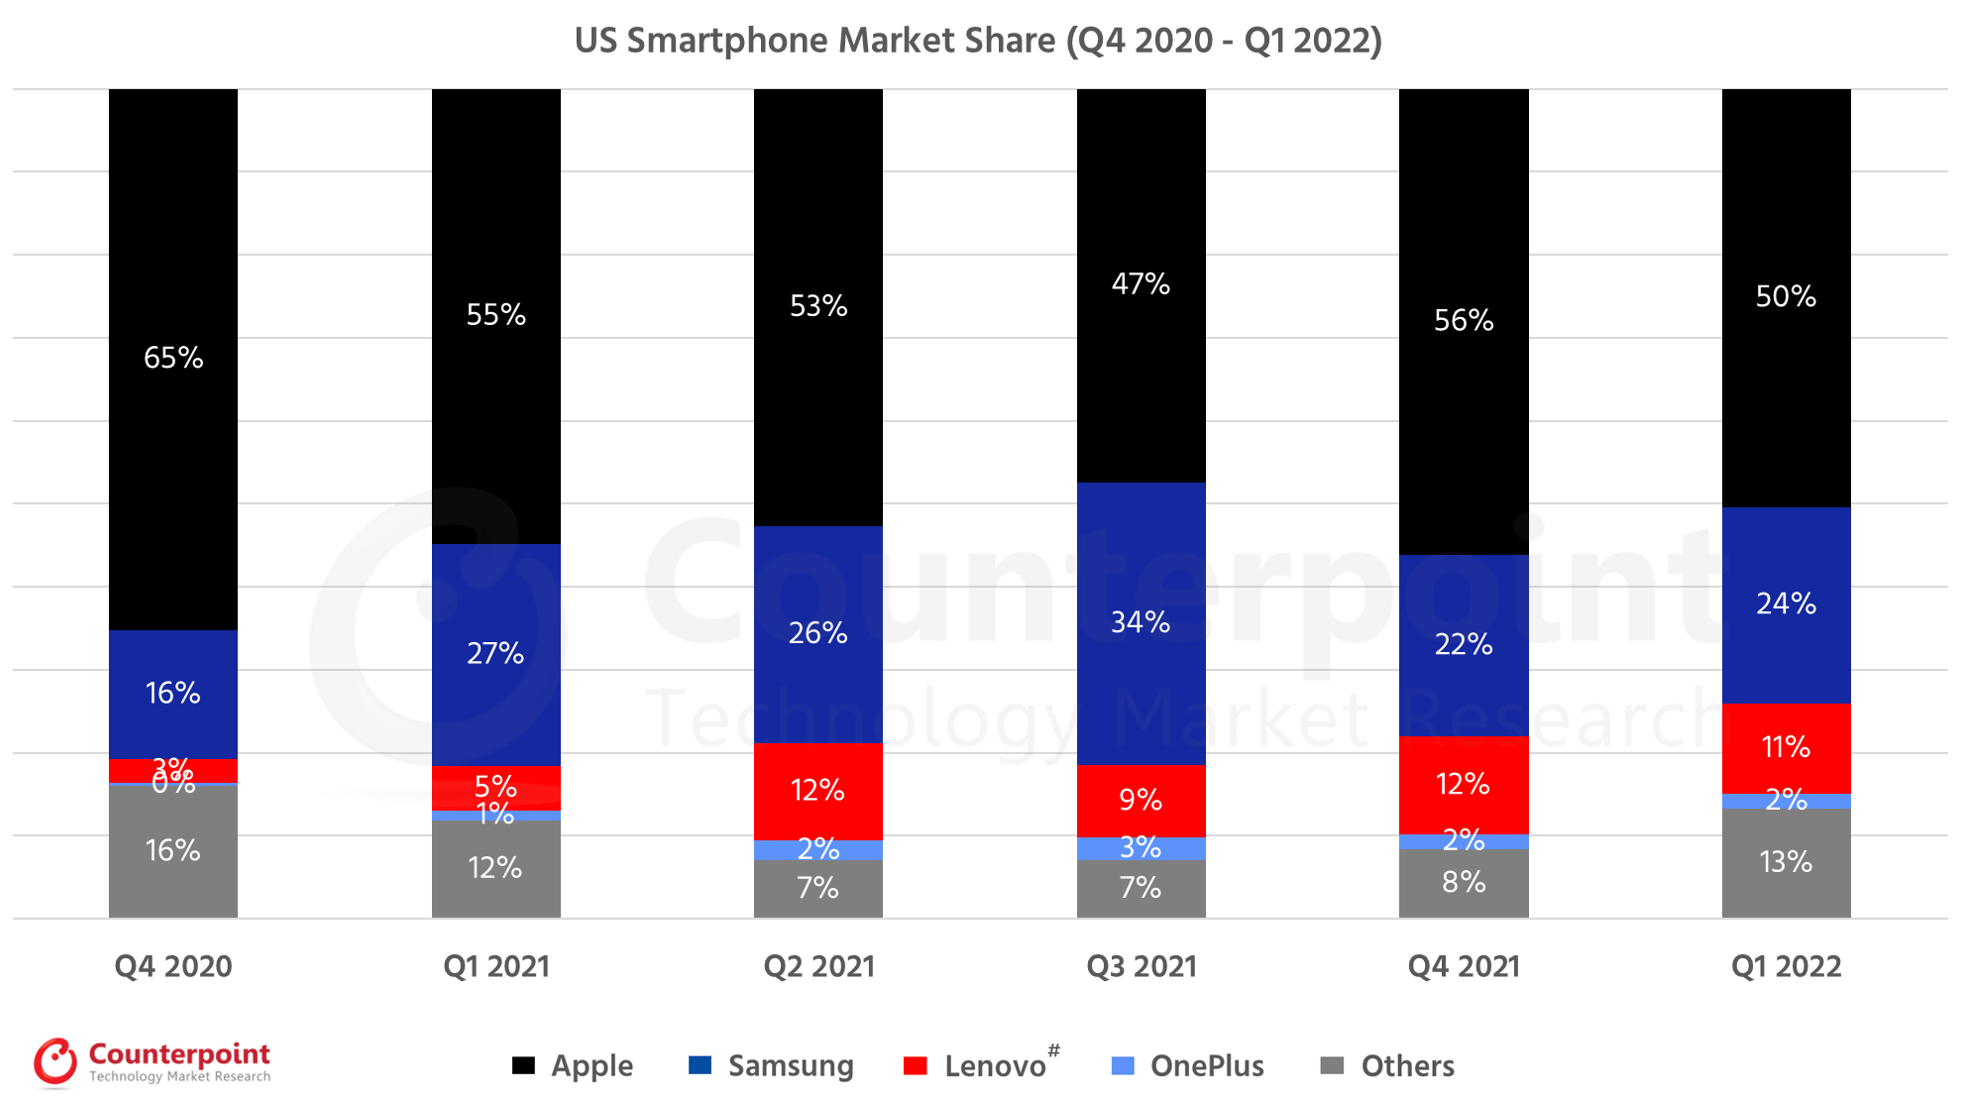
US Smartphone Shipments Market Data (Q4 2020 – Q1 2022)
-
Market Highlights
-
US Smartphone Shipments Market Share (%)
- Smartphone shipments grew 12% YoY as supply chain dynamics improved and fell 16% QoQ due to regular seasonality in Q1 2022.
- Apple grew 8% YoY due to strong demand for the iPhone 13 and channel-fill for the newly launched iPhone SE 2022.
- Samsung declined 7% YoY despite a successful Galaxy S-series launch and solid low-end demand for its A-series devices.
- Lenovo (Motorola) grew 127% YoY as it saw sales of its G-series models increase due to tax season promotions and deals.
| US Smartphone Market Share (%) | ||||||
| Brands | Q4 2020 | Q1 2021 | Q2 2021 | Q3 2021 | Q4 2021 | Q1 2022 |
| Apple | 65% | 55% | 53% | 47% | 56% | 50% |
| Samsung | 16% | 27% | 26% | 34% | 22% | 24% |
| Lenovo# | 3% | 5% | 12% | 9% | 12% | 11% |
| OnePlus | 0% | 1% | 2% | 3% | 2% | 2% |
| Others | 16% | 12% | 7% | 7% | 8% | 13% |
#Lenovo includes Motorola.
**Ranking is according to the latest quarter.
US Smartphone Shipments Market Data (Q3 2020 – Q4 2021)
-
Market Highlights
-
US Smartphone Shipments Market Share (%)
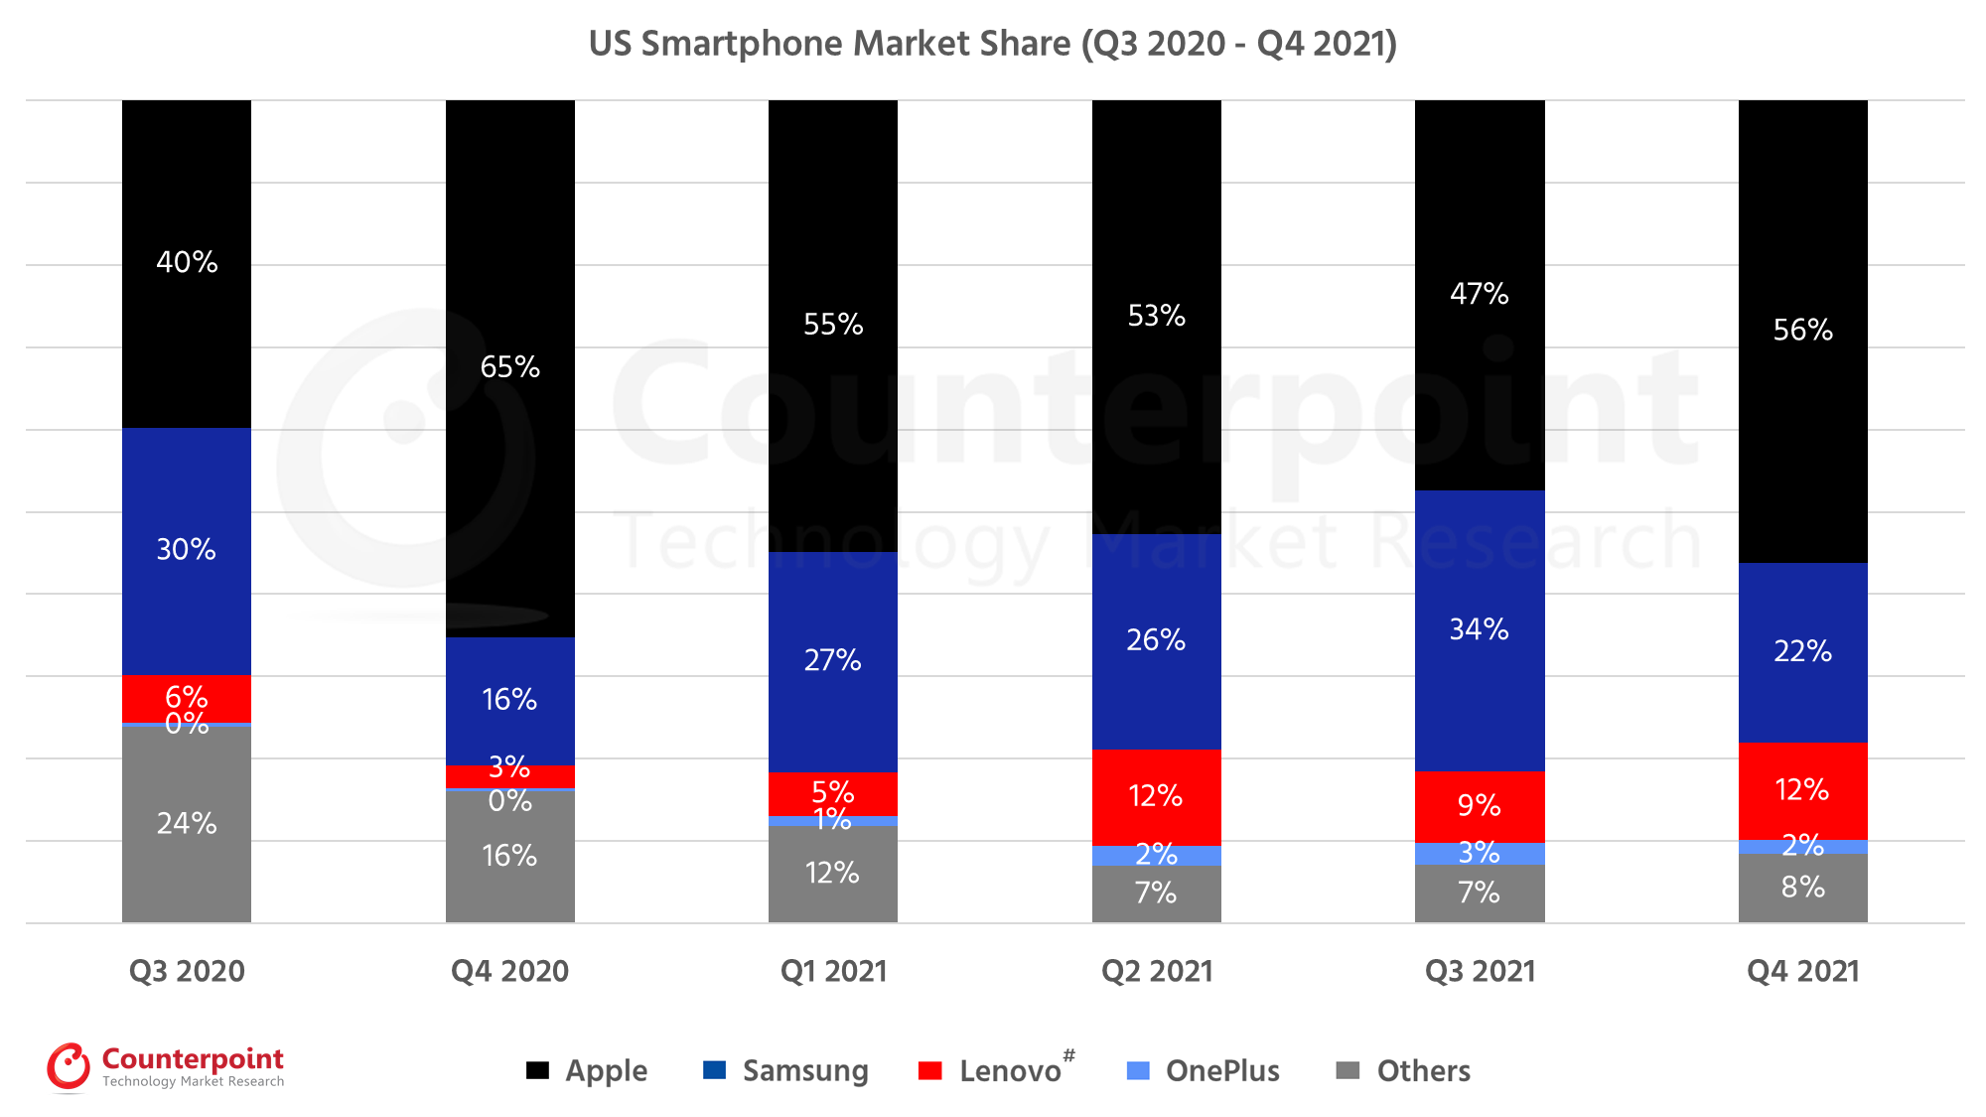
- Smartphone shipments grew 10% YoY and 30% QoQ in Q4 2021 as the new Apple iPhone 13 launched, filling channels with its latest premium devices for the holiday season.
- In the premium segment, although Apple grew 67% QoQ due to the new launch, Samsung declined -11% QoQ as it could not replenish its S21 series fast enough which also resulted in a decline in market share, down to 22%.
- Lenovo (Motorola) once again grew to 12% market share with the help of devices such as the Moto G Pure, which is the first major MediaTek device for the OEM in the US market.
| US Smartphone Market Share (%) | ||||||
| Brands | Q3 2020 | Q4 2020 | Q1 2021 | Q2 2021 | Q3 2021 | Q4 2021 |
| Apple | 40% | 65% | 55% | 53% | 47% | 56% |
| Samsung | 30% | 16% | 27% | 26% | 34% | 22% |
| Lenovo# | 6% | 3% | 5% | 12% | 9% | 12% |
| OnePlus | 0% | 0% | 1% | 2% | 3% | 2% |
| Others | 24% | 16% | 12% | 7% | 7% | 8% |
#Lenovo includes Motorola.
**Ranking is according to the latest quarter.
US Smartphone Shipments Market Data (Q2 2020 – Q3 2021)
-
Market Highlights
-
US Smartphone Shipments Market Share (%)
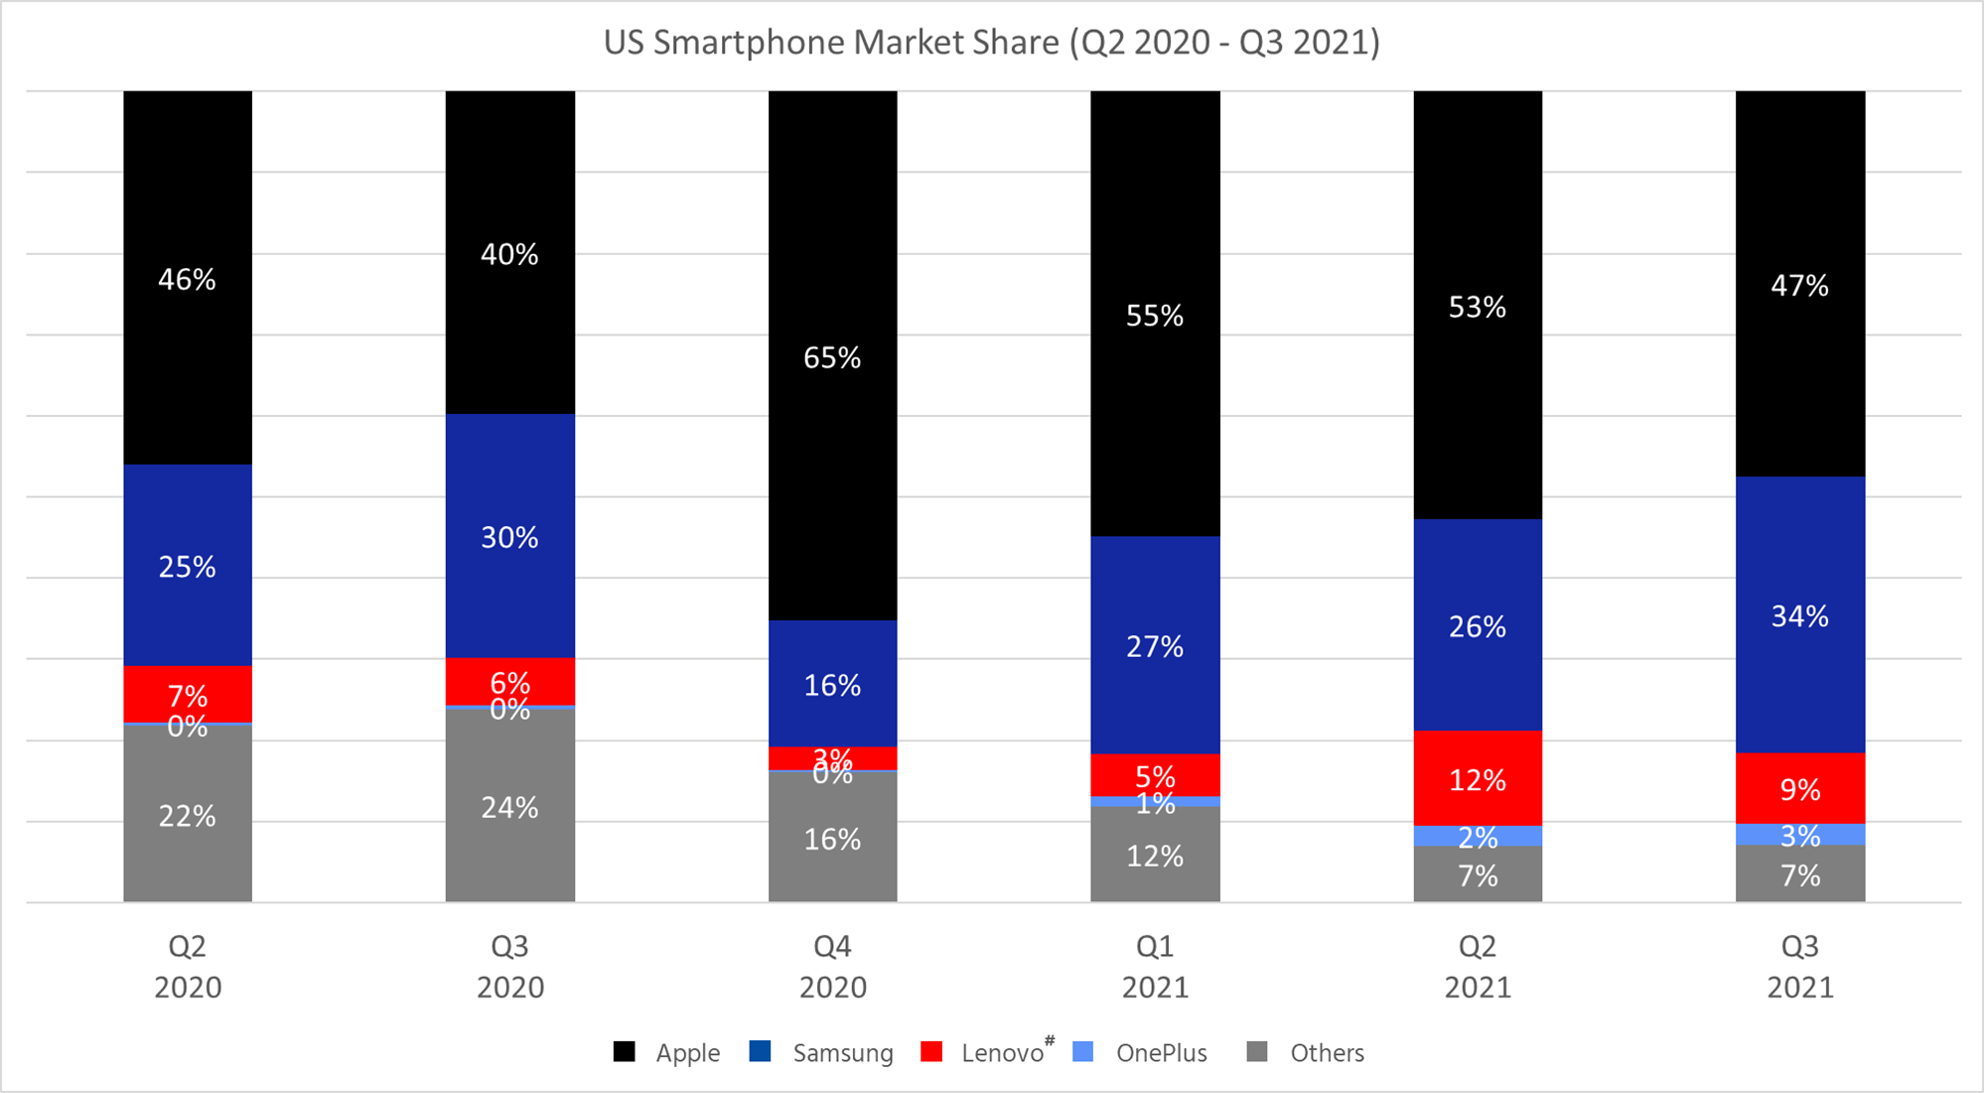
- Smartphone shipments grew 1% YoY and 6% QoQ in Q3 2021 despite supply constraints during the quarter.
- Apple grew 19% YoY due to a strong launch for the iPhone 13 series. As a result of the launch, Apple’s market share jumped from 40% in Q3 2020 to 47% in Q3 2021.
- Samsung shipment grew over 13% YoY and 38% QoQ driven by the resumption of regular operations at its Vietnam factories and the successful launch of its new foldable series
- Motorola and OnePlus were big gainers in Q3, capitalizing on LG’s exit from the market.
| US Smartphone Market Share (%) | Q2 2020 | Q3 2020 | Q4 2020 | Q1 2021 | Q2 2021 | Q3 2021 |
| Apple | 46% | 40% | 65% | 55% | 53% | 47% |
| Samsung | 25% | 30% | 16% | 27% | 26% | 34% |
| Lenovo# | 7% | 6% | 3% | 5% | 12% | 9% |
| OnePlus | 0% | 0% | 0% | 1% | 2% | 3% |
| Others | 22% | 24% | 16% | 12% | 7% | 7% |
#Lenovo includes Motorola.
**Ranking is according to the latest quarter.
US Smartphone Shipments Market Data (Q1 2020 – Q2 2021)
-
Market Highlights
-
US Smartphone Shipments Market Share (%)
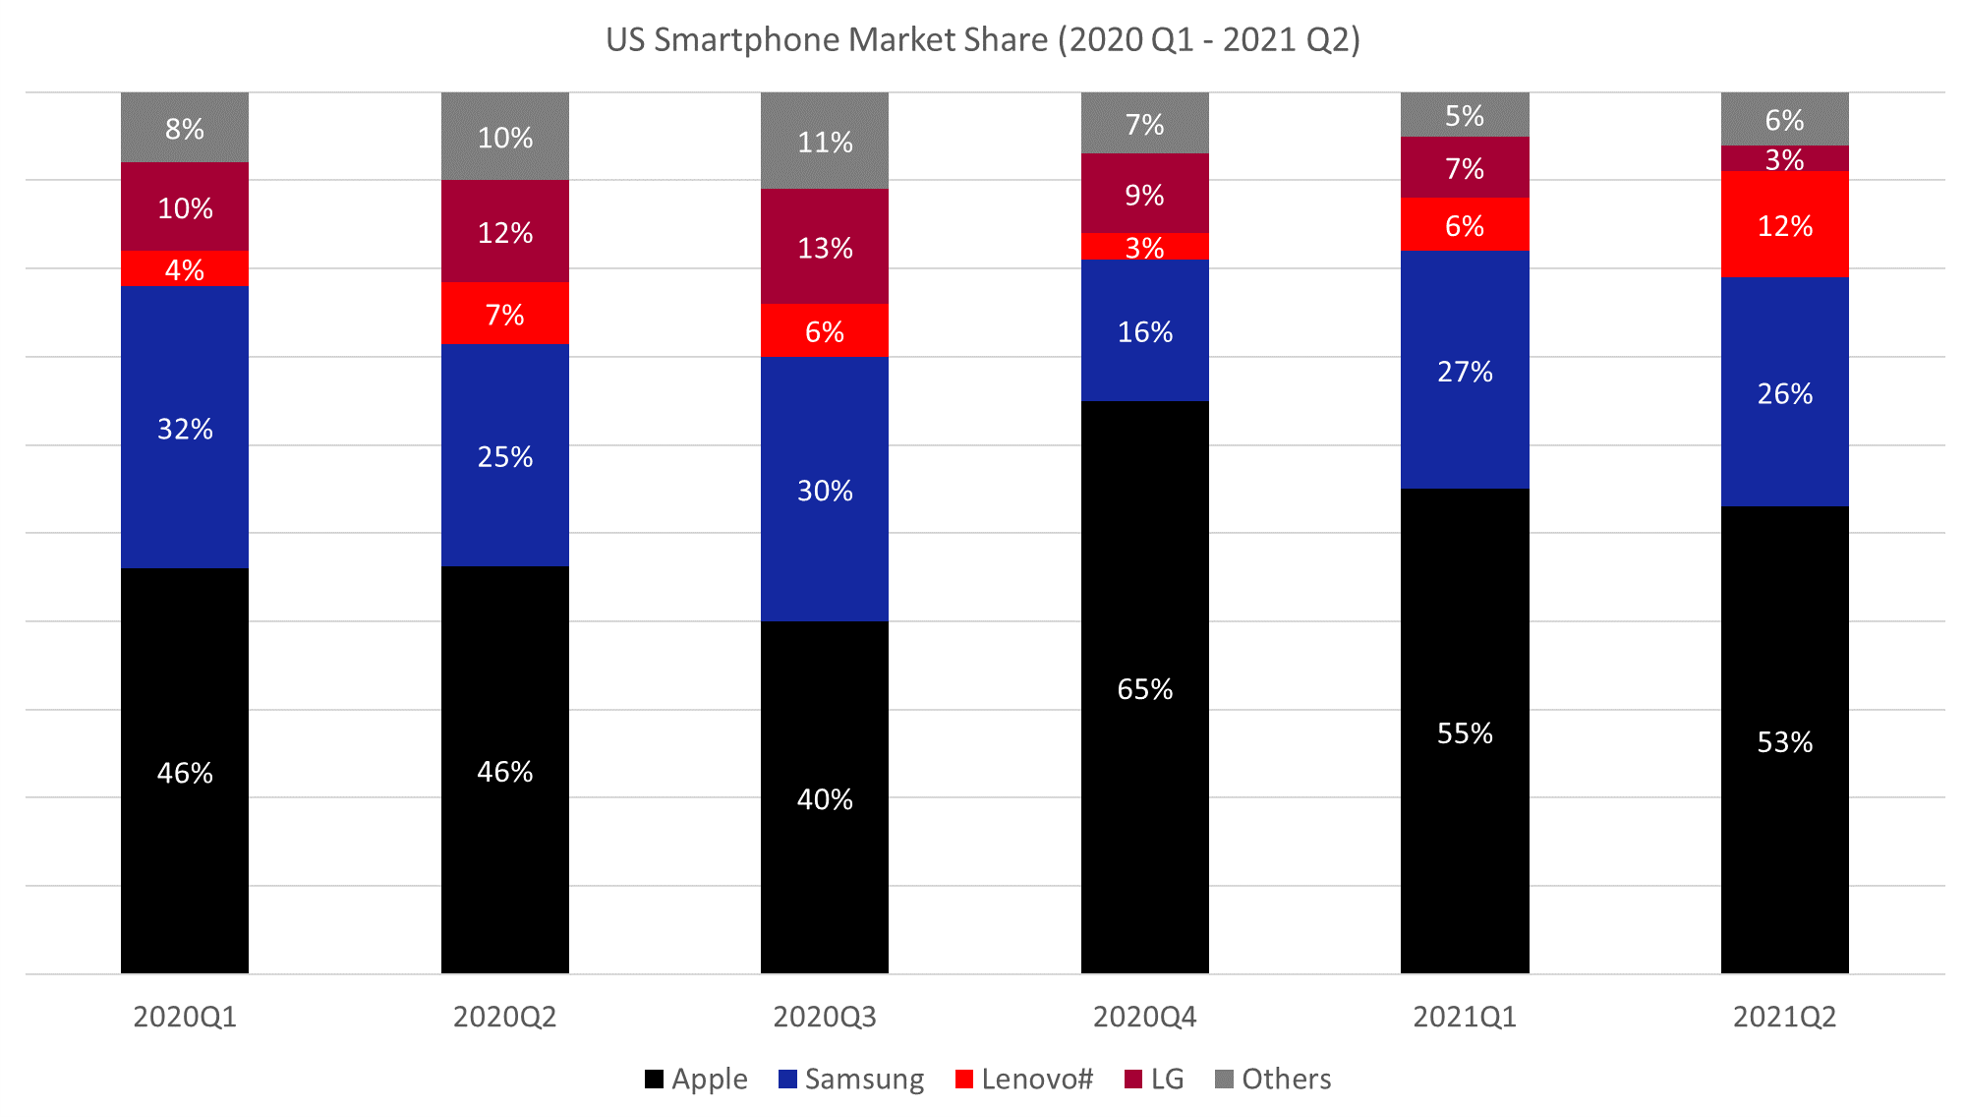
- Smartphone shipments grew 21% YoY in Q2 2021 continuing the positive momentum from Q1. It is likely shipments and growth could have been higher in Q2, but industry wide shortages curtailed this.
- Apple’s marketshare slightly lowered to 53%, although strong iPhone 12 demand remained. Overall Apple shipments grew 38% YoY. Some shortages of iPhone SE (2020) hindered prepaid growth.
- Samsung’s share dropped to 26%, but it also had positive YoY growth at 26%. Shortages, especially for A-series devices somewhat stifled Samsung’s growth potential.
- LG’s share drastically declined in Q2 2021, now at just 3%.
- Motorola and OnePlus were big gainers in Q2, capitalizing on LG’s weakness, especially in prepaid channels.
| US Smartphone Market Share (%) | ||||||
| Brands | 2020Q1 | 2020Q2 | 2020Q3 | 2020Q4 | 2021Q1 | 2021Q2 |
| Apple | 46% | 46% | 40% | 65% | 55% | 53% |
| Samsung | 32% | 25% | 30% | 16% | 27% | 26% |
| Lenovo# | 4% | 7% | 6% | 3% | 6% | 12% |
| LG | 10% | 12% | 13% | 9% | 7% | 3% |
| Others | 8% | 10% | 11% | 7% | 5% | 6% |
#Lenovo includes Motorola.
**Ranking is according to the latest quarter.
US Smartphone Shipments Market Data (Q4 2019 – Q1 2021)
-
Market Highlights
-
US Smartphone Shipments Market Share (%)
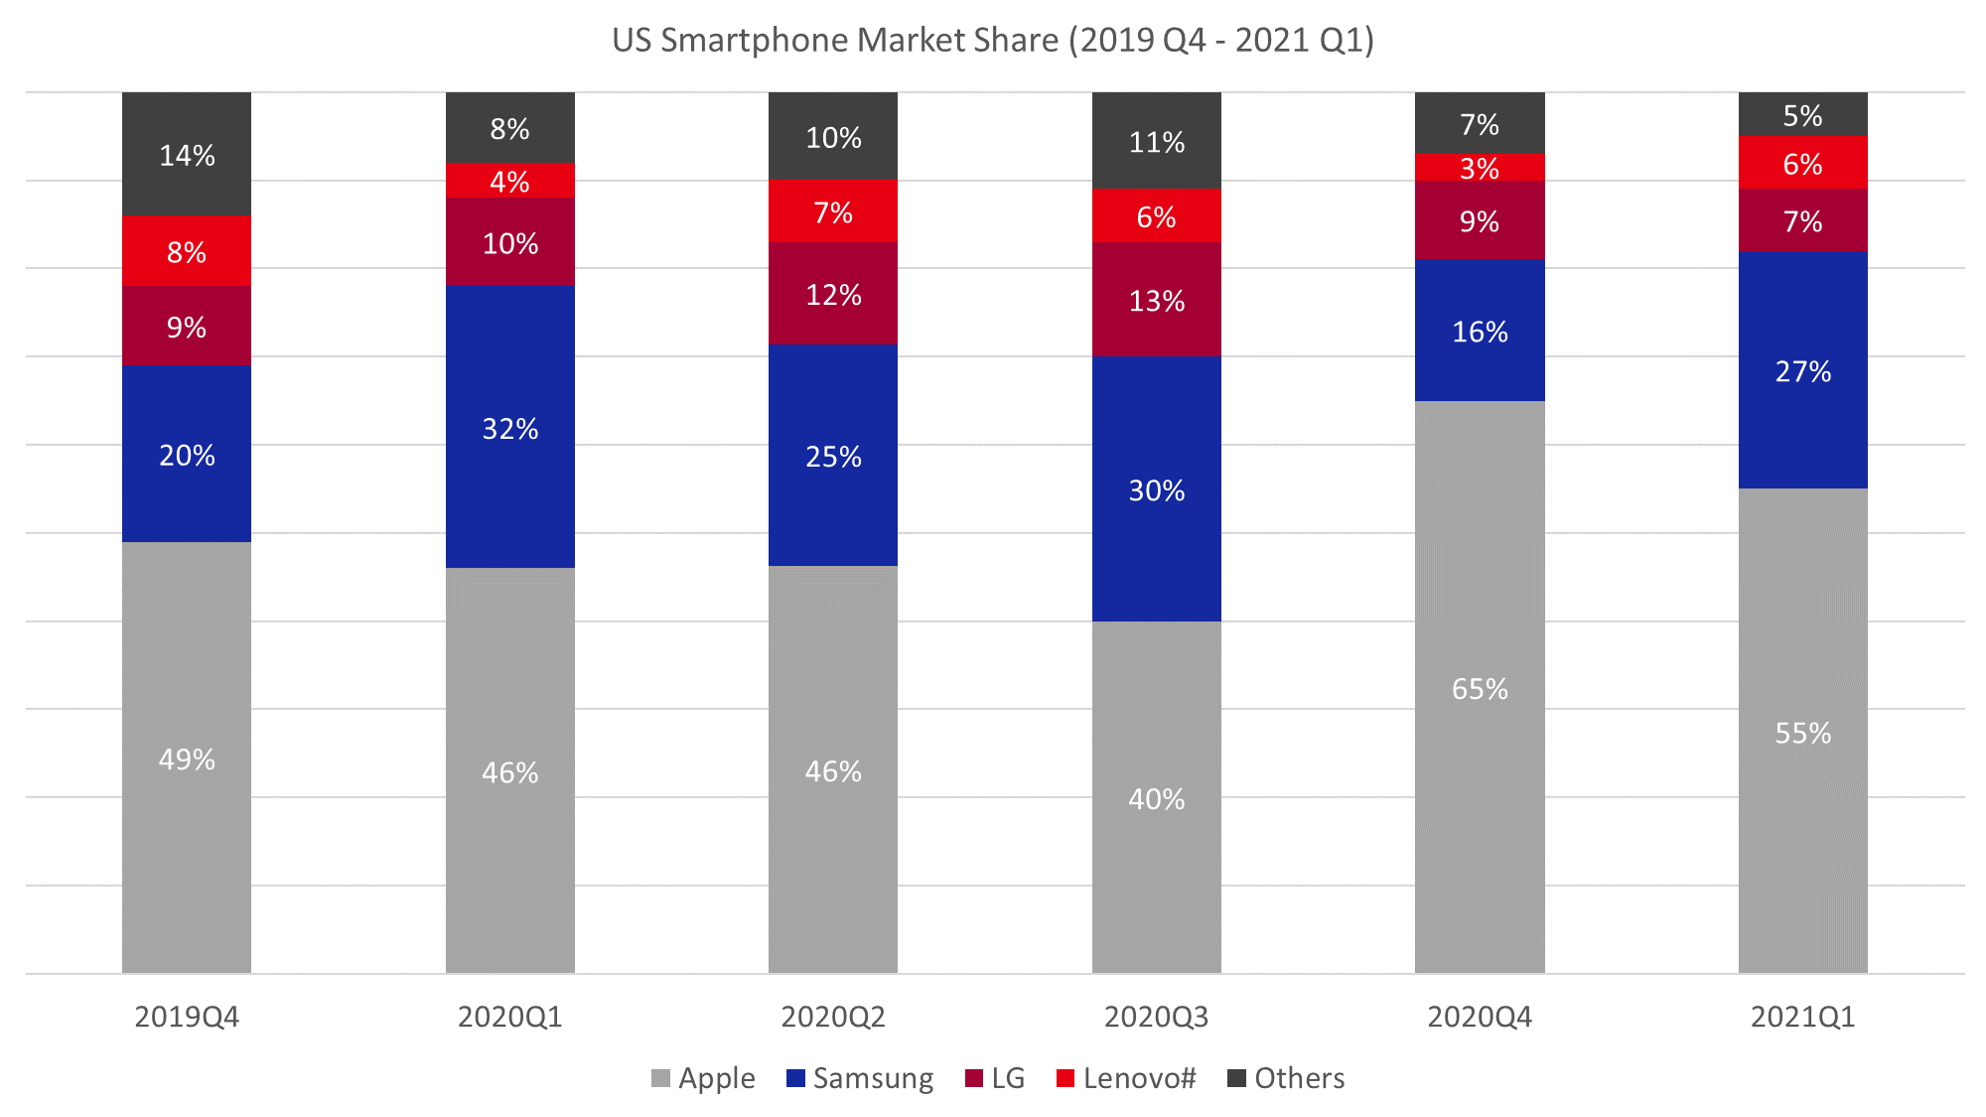
- Smartphone shipments grew 14% YoY in Q1 2021. Total market volumes were down QoQ, in-line with seasonal trends. Strong YoY growth came from higher than usual demand for premium devices.
- Apple’s market share remained high at 55% from strong iPhone 12 demand. Supply issues in Q4 2020 pushed demand into Q1. This spiked sales for iPhone 12 devices, which also benefitted from strong postpaid promotions.
- Samsung grew to 28% share through Samsung’s early launch of the Galaxy S21. Samsung launched its new Galaxy S21 in early February instead of March like in previous years. A-series devices also helped boost Samsung in prepaid channels.
- LG announced in early April that they would be leaving the smartphone business. We expect this share to decline drastically in Q2 2021
| US Smartphone Market Share (%) | ||||||
| Brands | 2019Q4 | 2020Q1 | 2020Q2 | 2020Q3 | 2020Q4 | 2021Q1 |
| Apple | 49% | 46% | 46% | 40% | 65% | 55% |
| Samsung | 20% | 32% | 25% | 30% | 16% | 27% |
| LG | 9% | 10% | 12% | 13% | 9% | 7% |
| Lenovo# | 8% | 4% | 7% | 6% | 3% | 6% |
| Others | 14% | 8% | 10% | 11% | 7% | 5% |
#Lenovo includes Motorola.
**Ranking is according to the latest quarter.
US Smartphone Shipments Market Data (Q3 2019 – Q4 2020)
-
Market Highlights
-
US Smartphone Shipments Market Share (%)
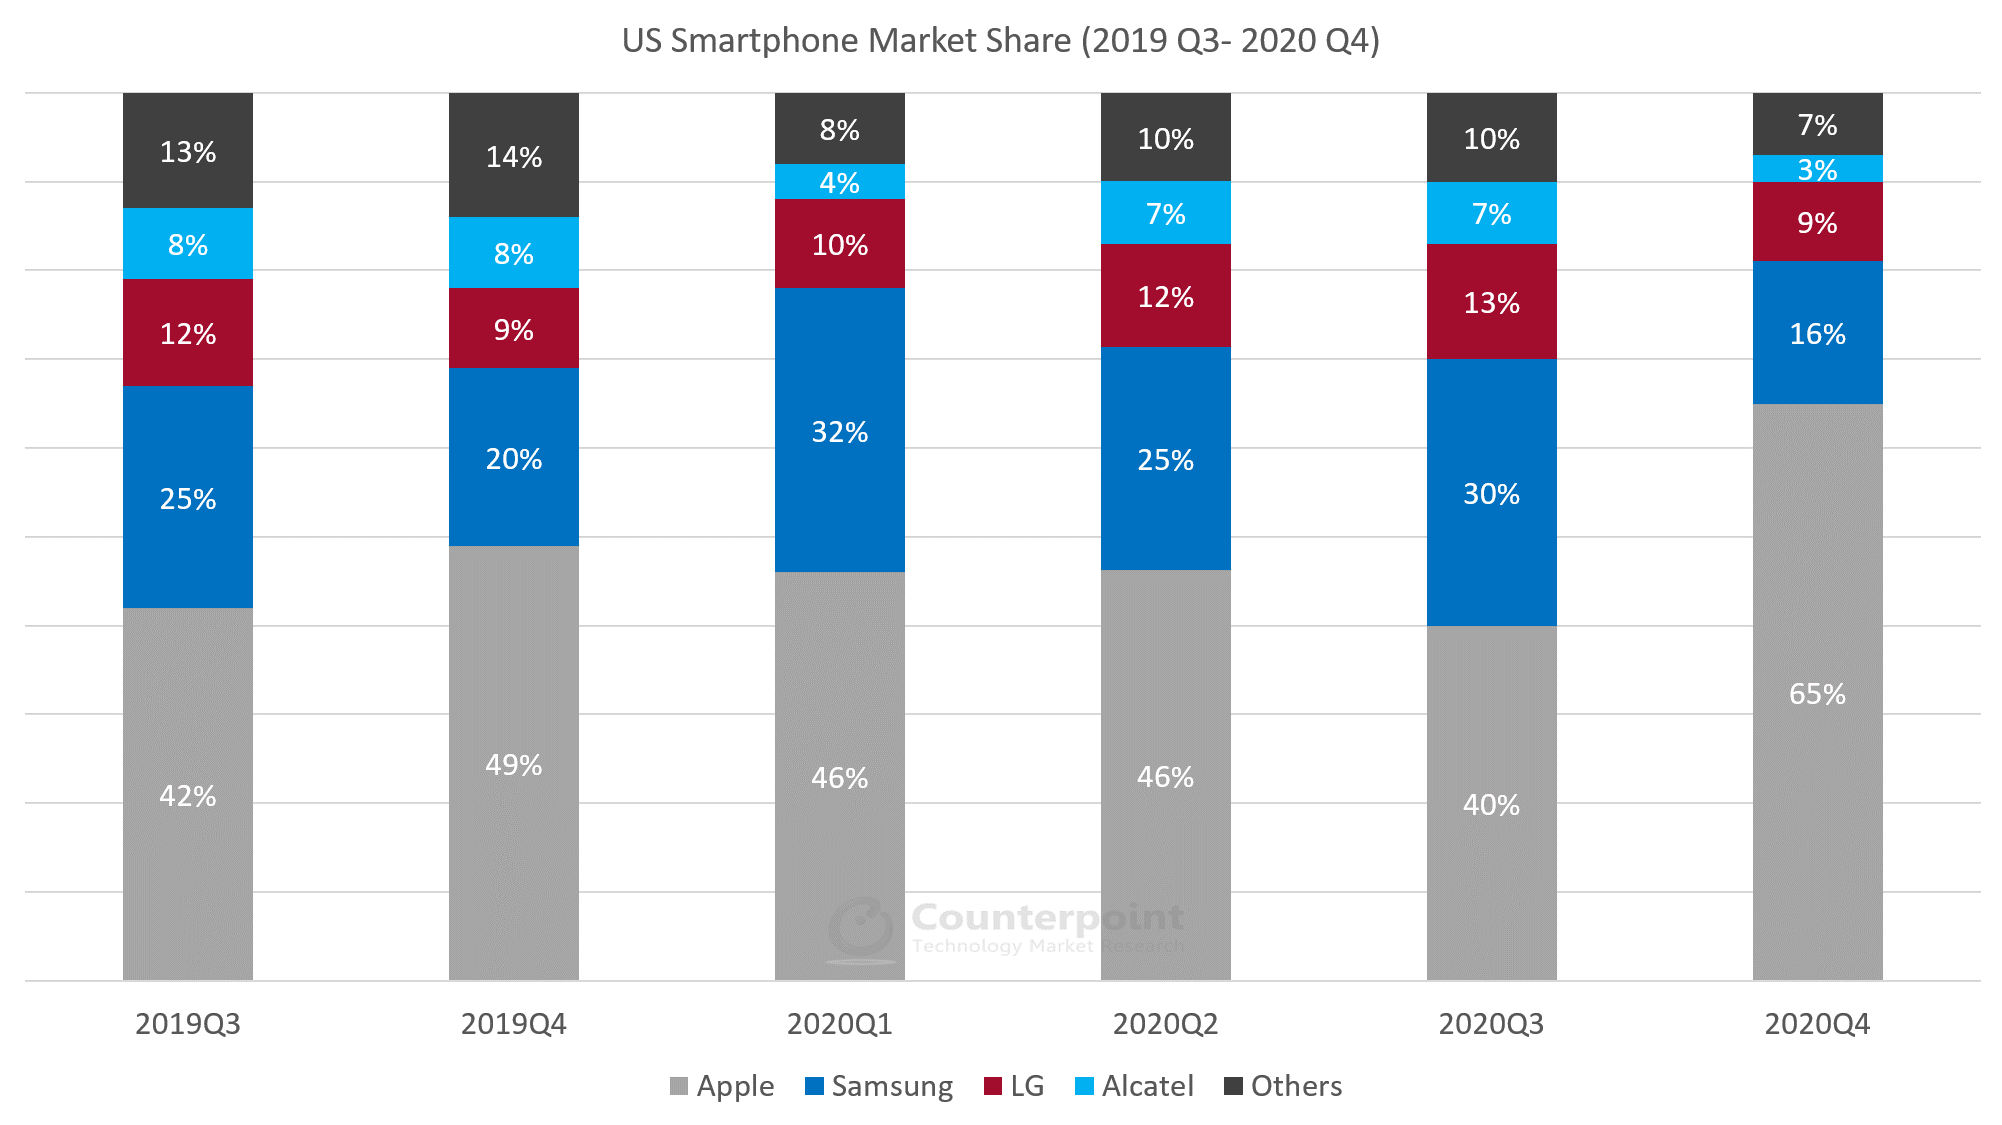
- The US smartphone market saw a 6% YoY decline in sales in Q4 2020 as COVID-19 continued to impact the economy.
- QoQ growth was at 24% due to record high iPhone sales and a strong demand for Samsung Galaxy devices.
- Apple grew 14% YoY despite a delayed iPhone 12 launch while Samsung gained 5% YoY.
- Apple and Samsung were the only OEMs to see positive growth in the quarter, thanks to new launches and a strong demand for premium devices during the holiday season.
- Despite the overall negative growth, there is good momentum going into 2021. Just as in Q3 2020, the market remained on the road to recovery in Q4.
| US Smartphone Market Share (%) | ||||||
| Brands | 2019Q3 | 2019Q4 | 2020Q1 | 2020Q2 | 2020Q3 | 2020Q4 |
| Apple | 42% | 49% | 46% | 46% | 40% | 65% |
| Samsung | 25% | 20% | 32% | 25% | 30% | 16% |
| LG | 12% | 9% | 10% | 12% | 13% | 9% |
| Alcatel | 8% | 8% | 4% | 7% | 7% | 3% |
| Others | 13% | 14% | 8% | 10% | 10% | 7% |
#Lenovo includes Motorola.
**Ranking is according to the latest quarter.
US Smartphone Shipments Market Data (Q2 2019 – Q3 2020)
-
Market Highlights
-
US Smartphone Shipments Market Share (%)
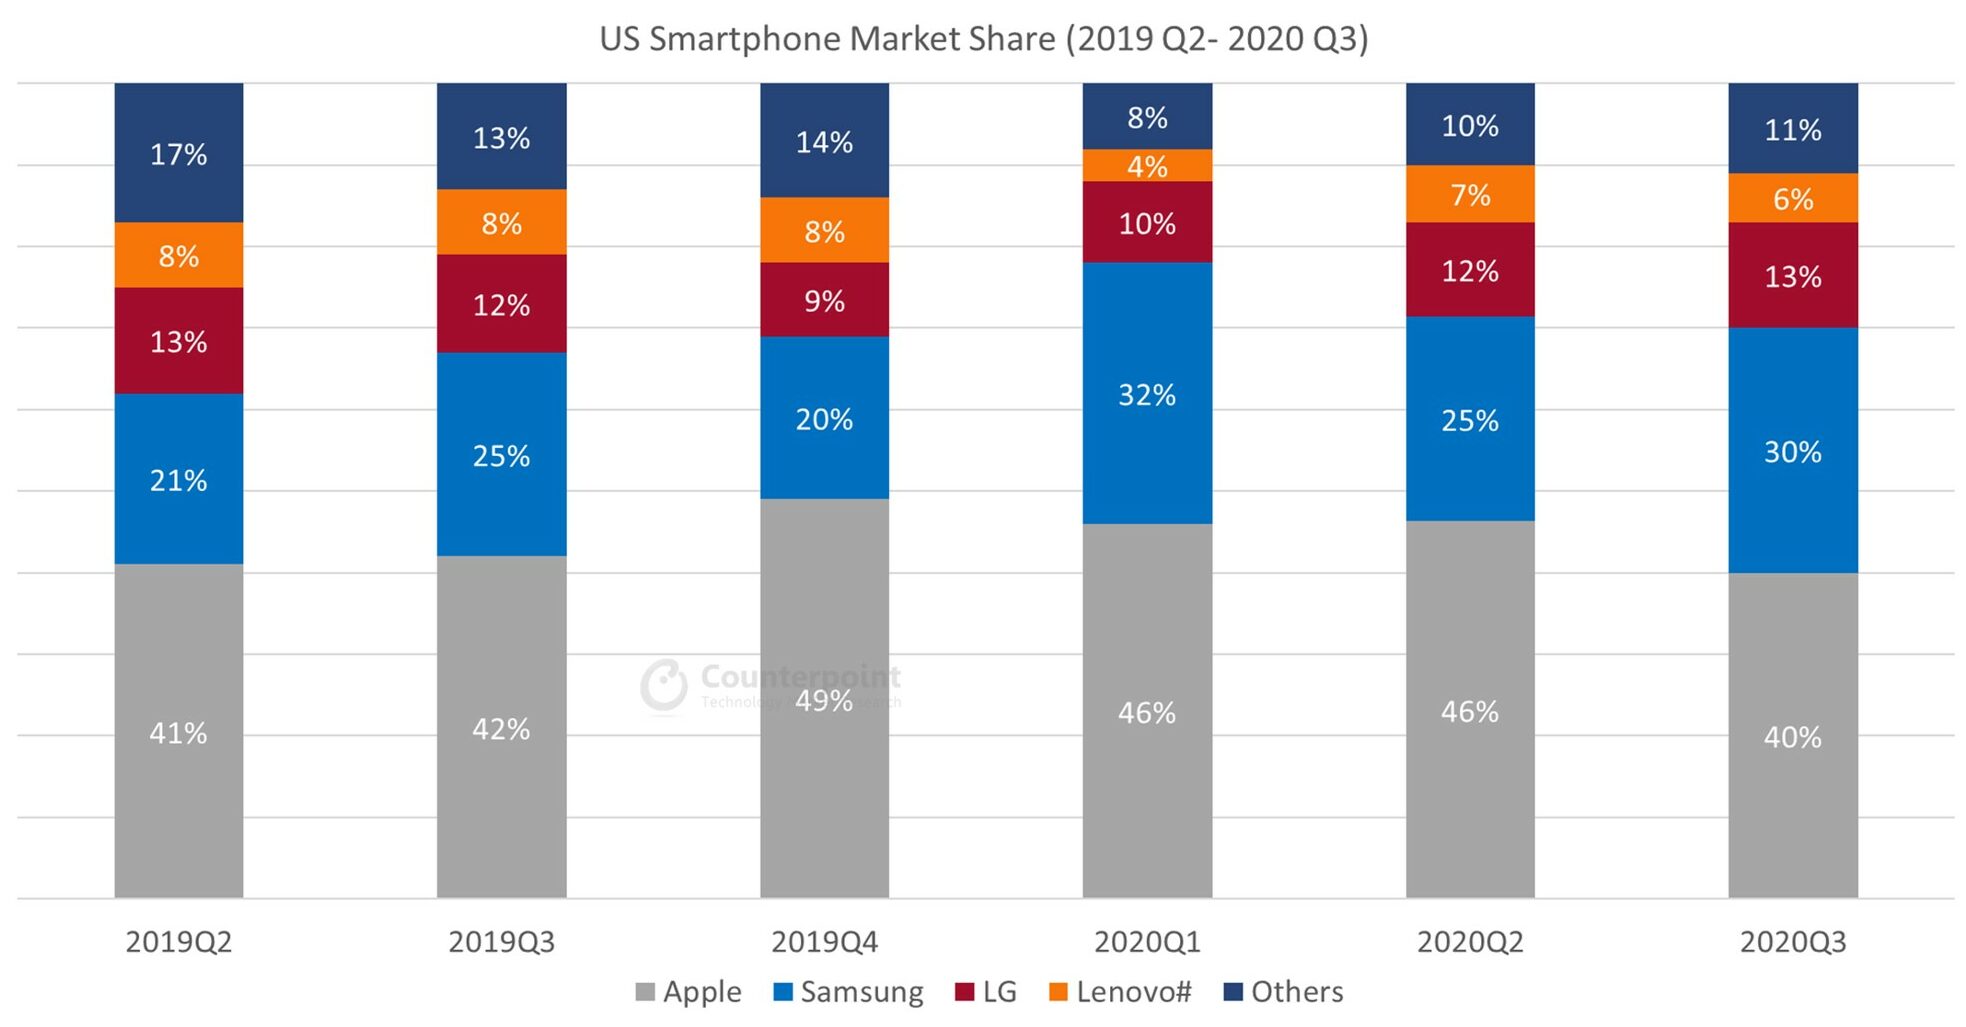
- During the third quarter of 2020, US smartphone sell-in fell 6% year-over-year due to continued COVID-19 impacts and seasonal demand drop ahead of the holiday quarter.
- However, in terms of quarter-on-quarter growth, the market had healthy recovery, increasing 27% QoQ.
- While Apple sell-in dropped to 40% share of the market, the continued success of the iPhone 11 series and the iPhone SE 2020 helped Apple maintain its position as the market leader.
- Samsung witnessed double-digit YoY growth as the A-series and the premium Galaxy Note 20 and Galaxy S20 series devices all performed well against other Android competition.
- LG grew its shipment share slightly due to new launches, including the LG Velvet 5G, and strong demand for the LG K51 in both prepaid and postpaid channels.
| USA Smartphone Market Share (%) | ||||||
| Brands | 2019 Q2 | 2019 Q3 | 2019 Q4 | 2020 Q1 | 2020 Q2 | 2020 Q3 |
| Apple | 41% | 42% | 49% | 46% | 46% | 40% |
| Samsung | 21% | 25% | 20% | 32% | 25% | 30% |
| LG | 13% | 12% | 9% | 10% | 12% | 13% |
| Lenovo# | 8% | 8% | 8% | 4% | 7% | 6% |
| Others | 17% | 13% | 14% | 8% | 10% | 11% |
#Lenovo includes Motorola.
**Ranking is according to the latest quarter.
US Smartphone Shipments Market Data (Q1 2019 – Q2 2020)
-
Market Highlights
-
US Smartphone Shipments Market Share (%)
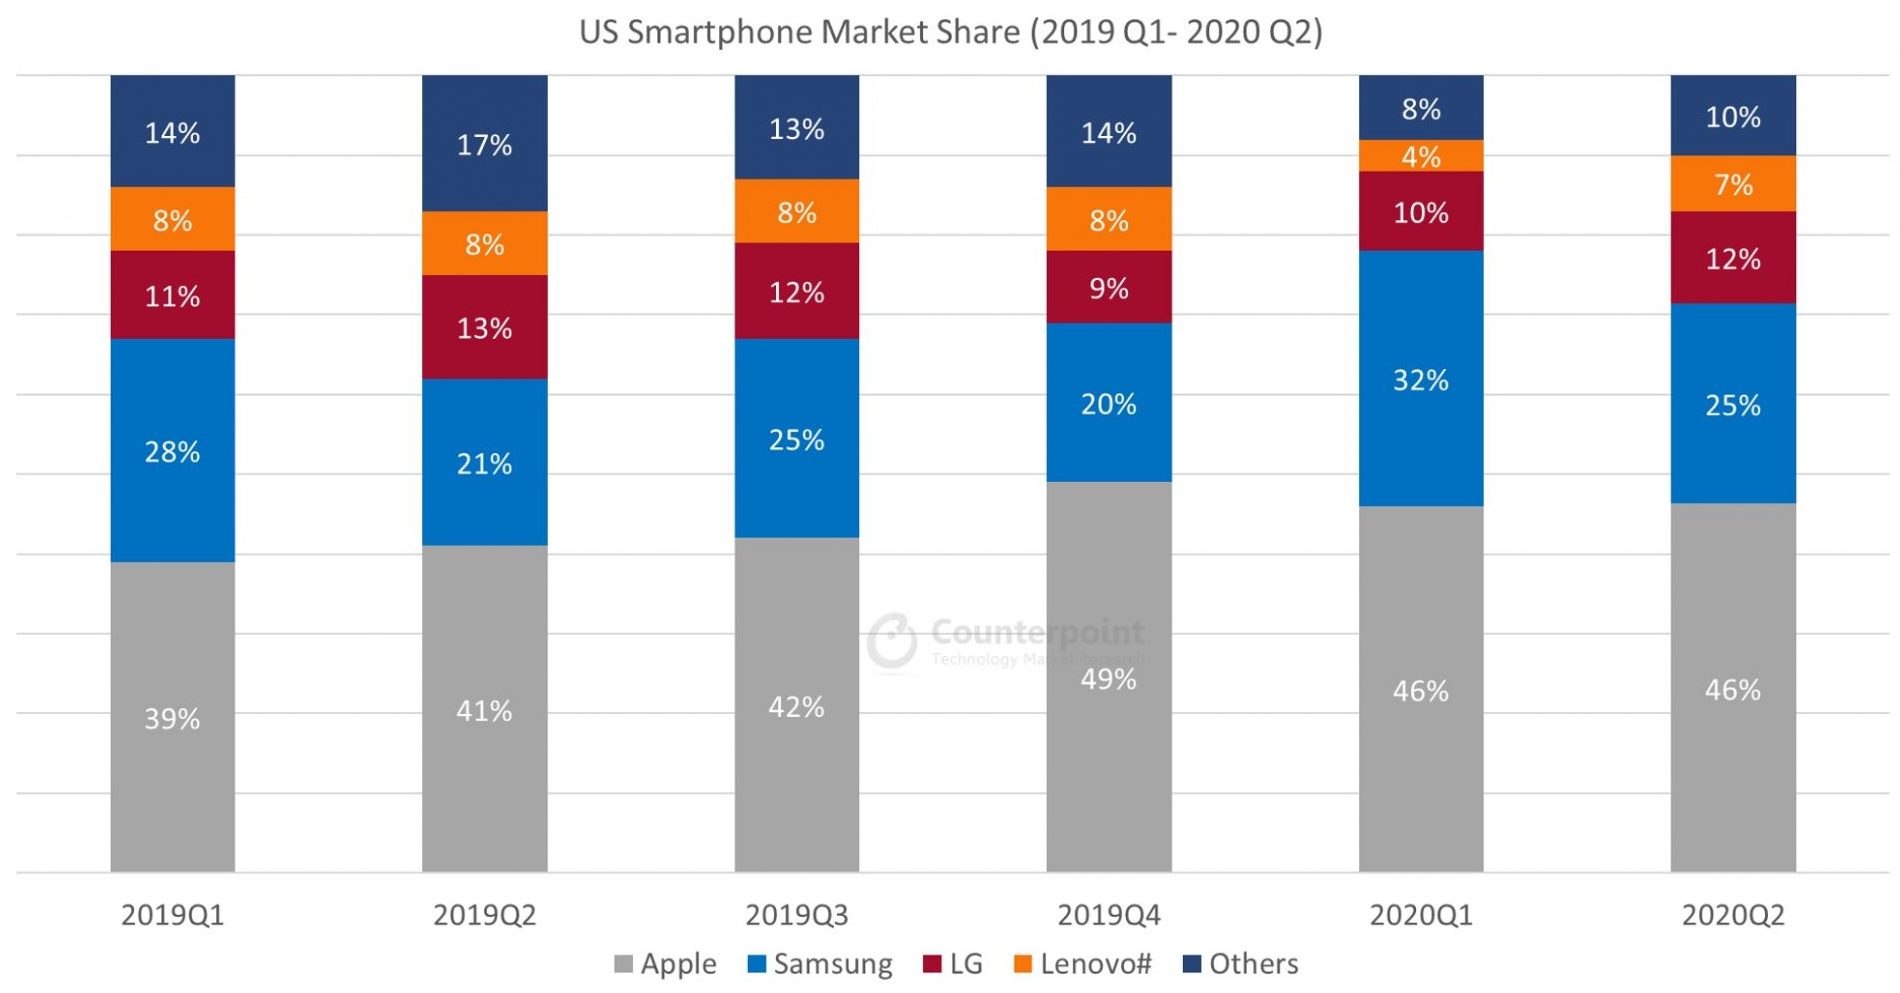
- During the second quarter of 2020, US smartphone sell-through fell 25% year-over-year.
- Prepaid channels were hurt the most during the COVID-19 outbreak despite a higher percentage of stores remaining open compared to postpaid.
- Postpaid channels declined 20%, a steep fall but one partly offset by an almost doubling of the percentage of devices sold online.
- All OEMs were down in Q2 year-over-year. Due to lockdowns, the share of online sales grew to 31% from 14% last year.
- However, because of a strong online presence, Samsung and Apple volumes fared better than the overall market aided by a higher percentage of online sales.
| US Smartphone Market Share (%) | ||||||
| Brands | 2019 Q1 | 2019 Q2 | 2019 Q3 | 2019 Q4 | 2020 Q1 | 2020 Q2 |
| Apple | 39% | 41% | 42% | 49% | 46% | 46% |
| Samsung | 28% | 21% | 25% | 20% | 32% | 25% |
| LG | 11% | 13% | 12% | 9% | 10% | 12% |
| Lenovo# | 8% | 8% | 8% | 8% | 4% | 7% |
| Others | 14% | 17% | 13% | 14% | 8% | 10% |
#Lenovo includes Motorola.
**Ranking is according to the latest quarter.
US Smartphone Shipments Market Data (Q1 2019 – Q1 2020)
-
Market Highlights
-
US Smartphone Shipments Market Share (%)
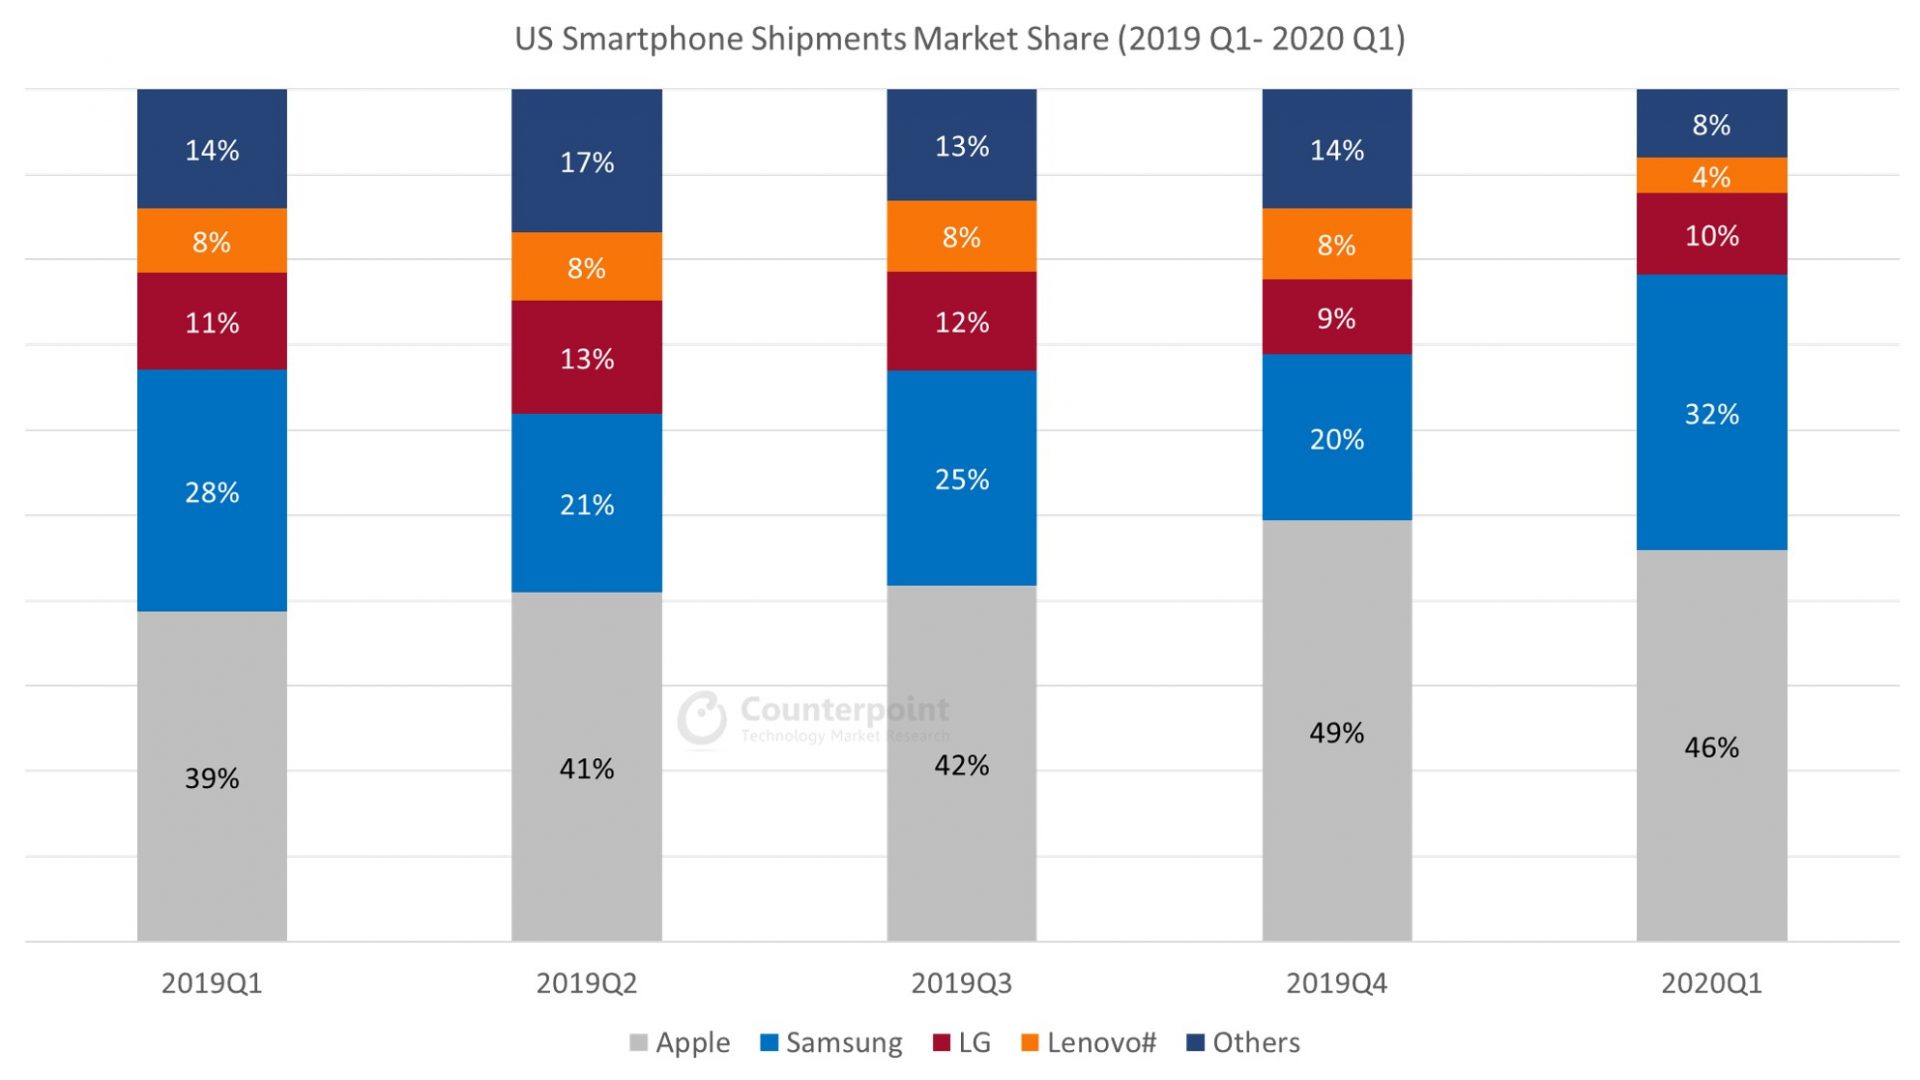
- According to Counterpoint’s latest US Channel Share Tracker, Q1 2020 saw a 21% year-over-year (YoY) decline in US smartphone sales driven by store closures and stay-at-home orders in the latter part of the quarter.
- Apple only declined 13% YoY, which is far better than the other tier one OEMs. Samsung declined 23% YoY.
- The A-series continued to be a sales driver for the OEM as S20 series sales were off to a weak start due to COVID-19 shutdowns taking affect right as devices hit the market.
- OnePlus did see growth in the quarter, their sales grew YoY from a small base. OnePlus continues to make inroads into US carrier markets, especially through their competitively priced 5G smartphone offerings.
| US Smartphone Market Share (%) | |||||
| Brands | 2019 Q1 | 2019 Q2 | 2019 Q3 | 2019 Q4 | 2020 Q1 |
| Apple | 39% | 41% | 42% | 49% | 46% |
| Samsung | 28% | 21% | 25% | 20% | 32% |
| LG | 11% | 13% | 12% | 9% | 10% |
| Lenovo# | 8% | 8% | 8% | 8% | 4% |
| Others | 14% | 17% | 13% | 14% | 8% |
#Lenovo includes Motorola.
**Ranking is according to the latest quarter.
US Smartphone Shipments Market Data (Q4 2018 – Q4 2019)
-
Market Highlights
-
US Smartphone Shipments Market Share (%)
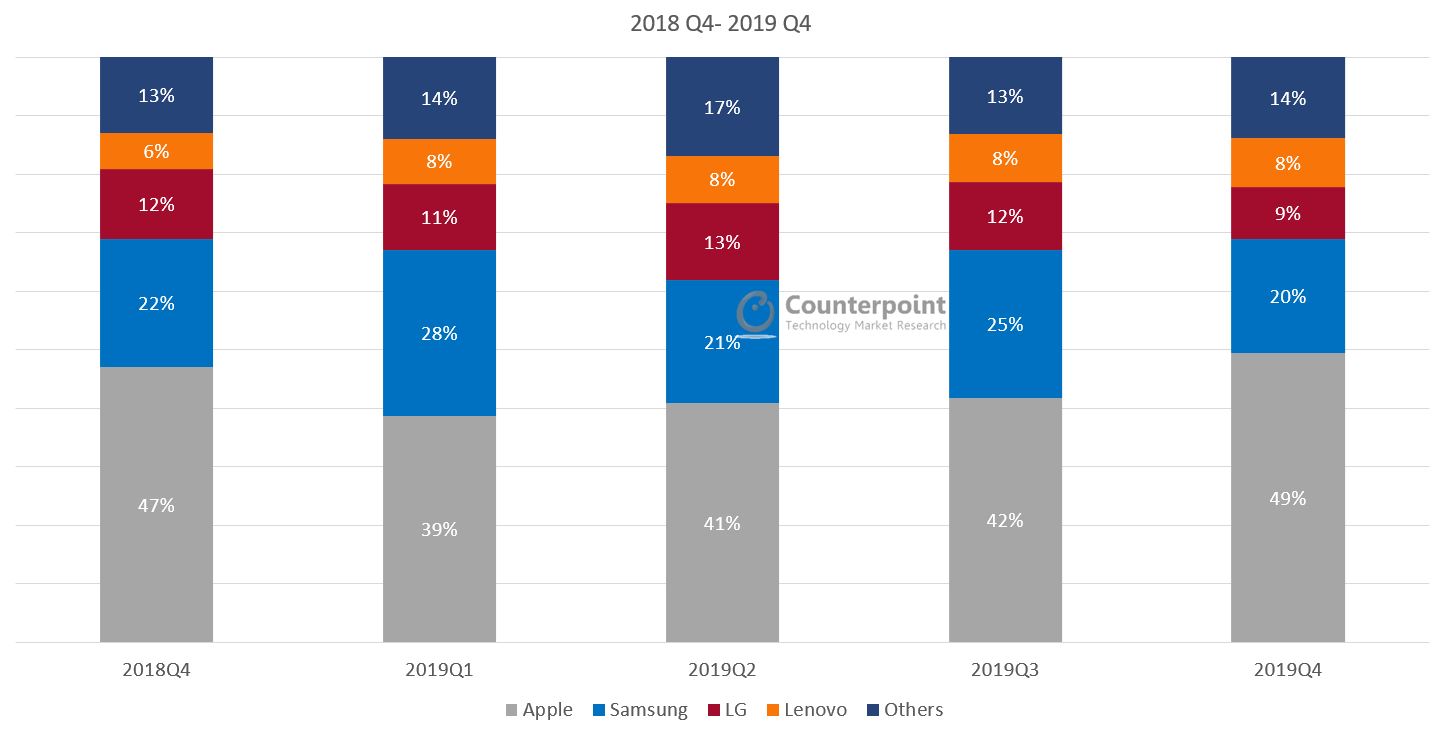
- The US smartphone market declined 1% YoY due to weak upgrades and increase in the average holding periods, especially in the premium segment. Flagship sales have remained sluggish especially for Samsung and LG which faced tough competition from Apple.
- Apple increased 7% YoY with the help of the new iPhone 11 series. The iPhone 11 was the best selling device for Apple during the quarter.
- Samsung declined 8% YoY despite recent success of A series. There has been 5G sales, but not enough for OEM to stem the decline in sales year over year.
- LG declined 24% YoY as flagship sales faltered. The LG V50 was one of the first 5G devices on the market, but is now facing a tough competition from Samsung Note 10 5G.
- Among the “Others” OnePlus grew 182% YoY from a small base. The OEM has two 5G capable devices in carrier channels currently which has helped it grow.
| US Smartphone Market Share (%) | 2018
Q4 | 2019
Q1 | 2019
Q2 | 2019
Q3 | 2019
Q4 |
| Apple | 47% | 39% | 41% | 42% | 49% |
| Samsung | 22% | 28% | 21% | 25% | 20% |
| LG | 12% | 11% | 13% | 12% | 9% |
| Lenovo# | 6% | 8% | 8% | 8% | 8% |
| Others | 13% | 14% | 17% | 13% | 14% |
#Lenovo includes Motorola.
**Ranking is according to the latest quarter.
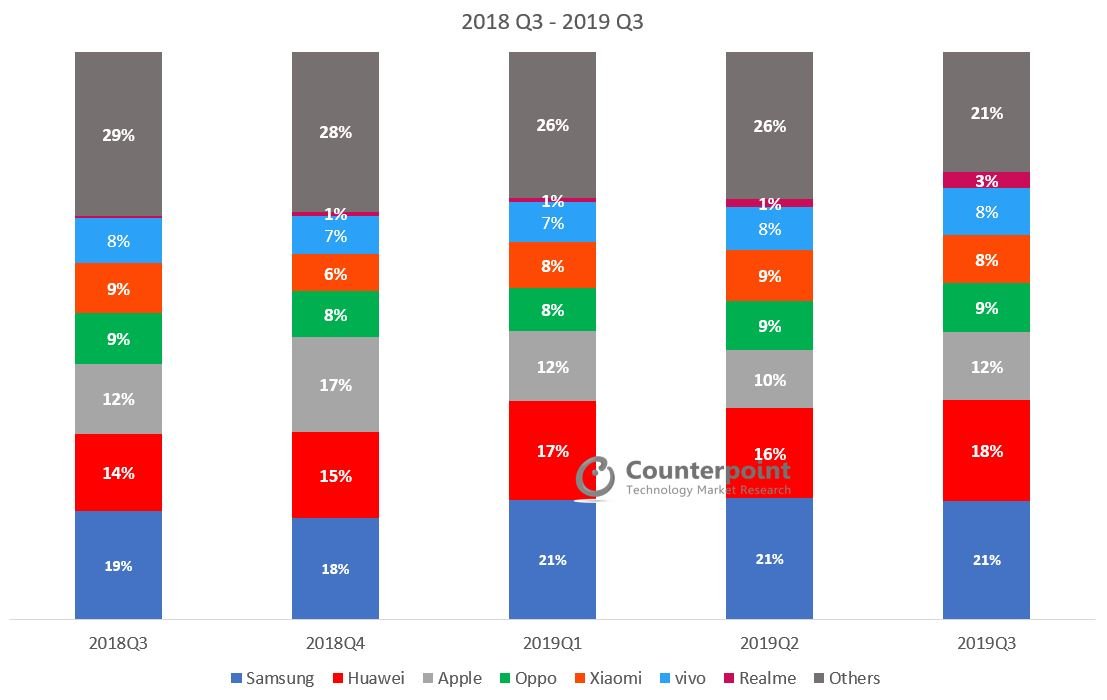
US Smartphone Shipments Market Data (Q3 2018 – Q3 2019)
-
Market Highlights
-
US Smartphone Shipments Market Share (%)
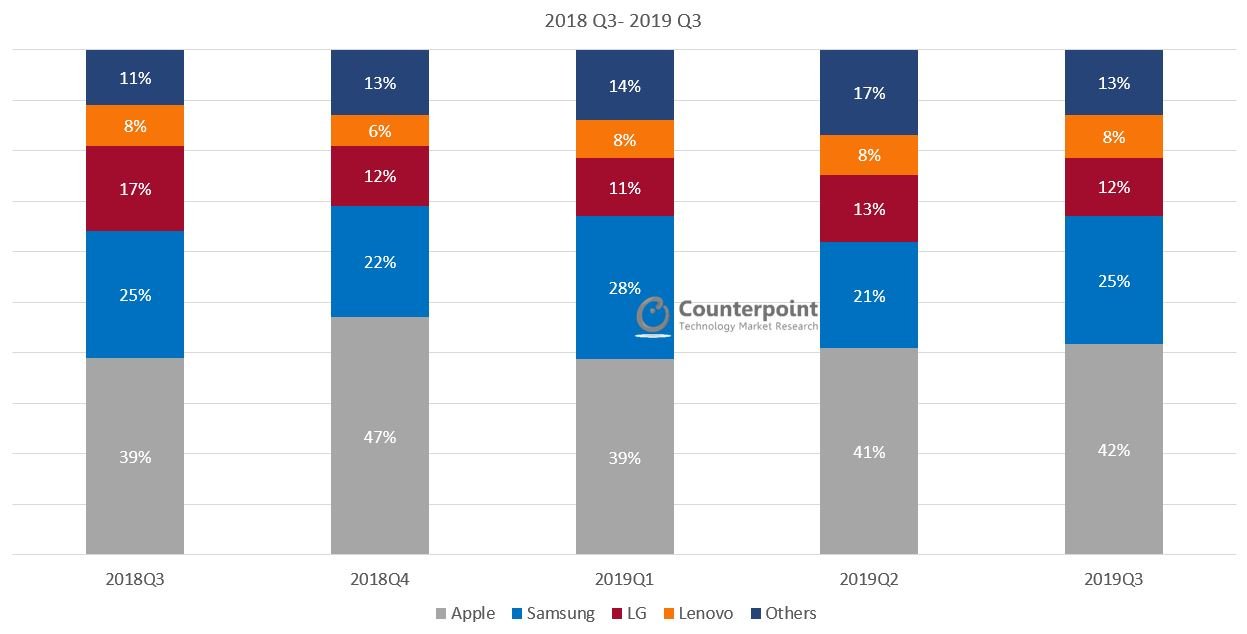
- Smartphone volumes fell 2% YoY, from continued weakness of high-end premium Android devices. Mid-tier devices increased in sales but could not offset the premium decline.
- Apple increased YoY with the help of the new iPhone 11 series. The iPhone 11 quickly became the flagship device of choice for budget conscious Apple fans. Apple continues to make headways with its services expansion, launching Apple TV+.
- Samsung declines another quarter. The S10 series continues to see weakness in the premium line-up. The Note 10 shows promise and the Note 10 Plus 5G could become a strong 5G seller as carriers are experimenting with different monthly pricing configurations and financing options.
- Among the “Others” Google Pixel grew 139% YoY as the Pixel 3a and 3a XL are overtaking sales of the Pixel 3. Google will look to the Pixel 4 in Q4 to help boost its premium device sales however early market response for the device seems lackluster.
| US Smartphone Market Share (%) | 2018
Q3 | 2018
Q4 | 2019
Q1 | 2019
Q2 | 2019
Q3 |
| Apple | 39% | 47% | 39% | 41% | 42% |
| Samsung | 25% | 22% | 28% | 21% | 25% |
| LG | 17% | 12% | 11% | 13% | 12% |
| Lenovo# | 8% | 6% | 8% | 8% | 8% |
| Others | 11% | 13% | 14% | 17% | 13% |
#Lenovo includes Motorola.
**Ranking is according to the latest quarter.
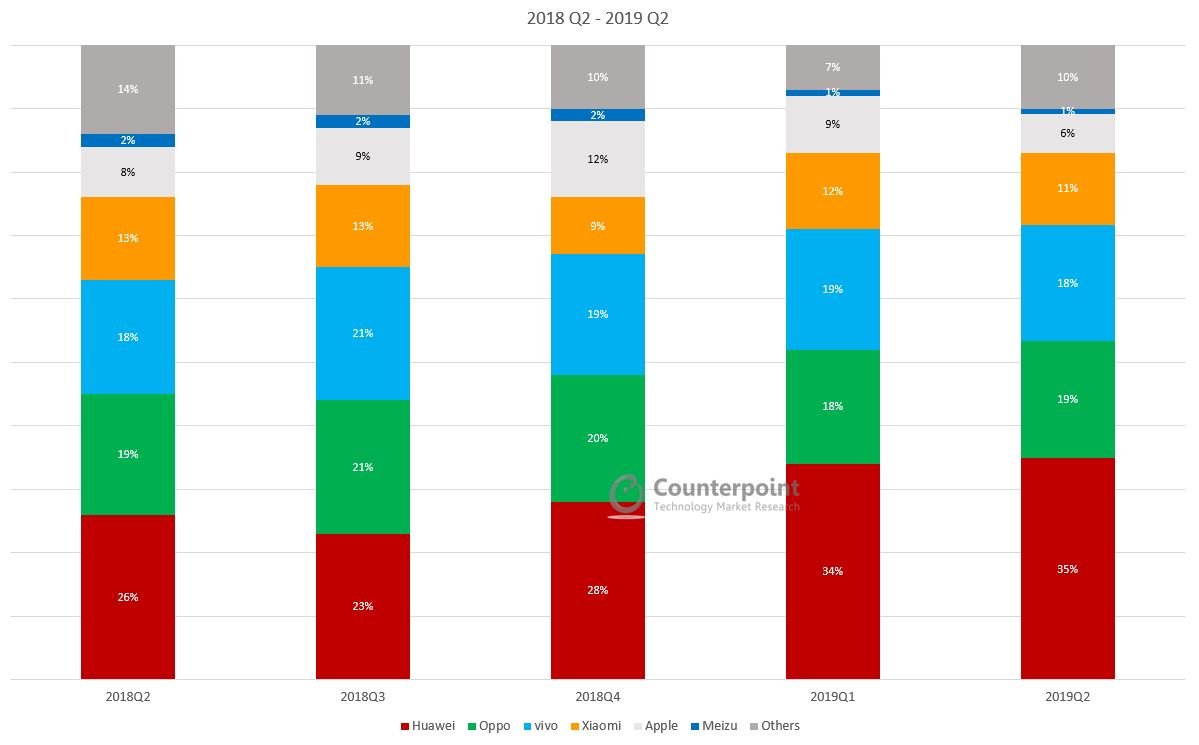
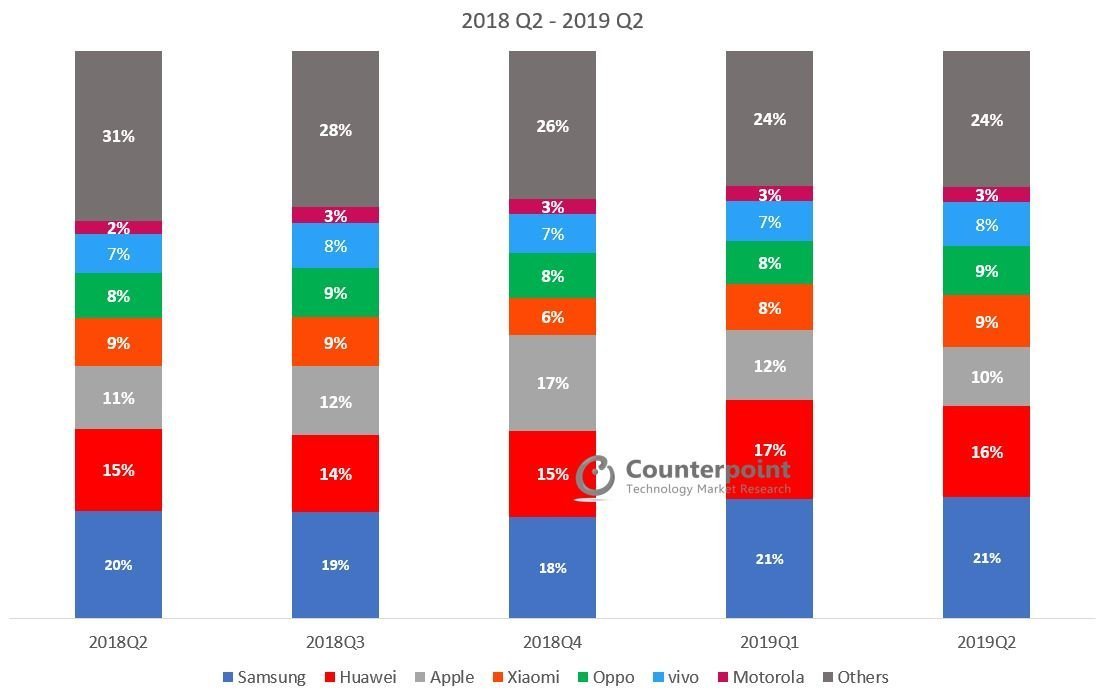
US Smartphone Shipments Market Data (Q2 2018 – Q2 2019)
-
Market Highlights
-
US Smartphone Shipments Market Share (%)
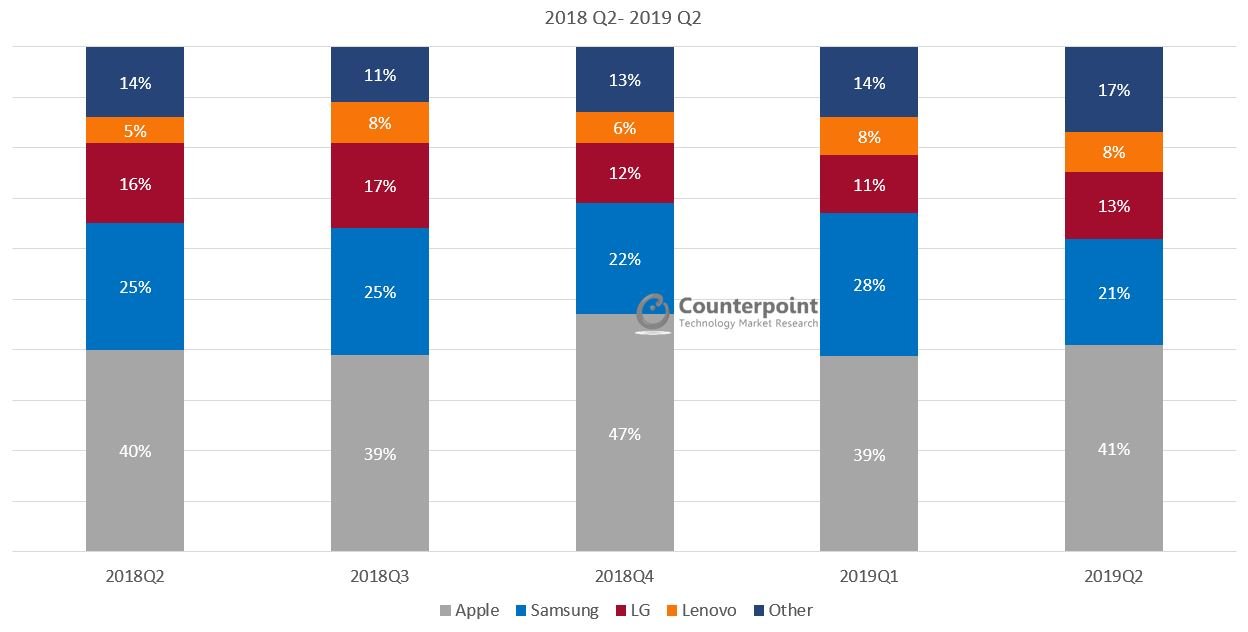
- US sell through declined 1.5% year-over-year. The US premium market softened with holding periods continuing to increase.
- We are seeing a shift away from premium devices as Apple showed a YoY increase through the continued success of the XR as its top seller.
- Samsung declined as Galaxy S10 sales began to waver in Q2. Samsung had a solid launch of the Galaxy S10 series but is now seeing signs of weakness.
- Most Apple and Samsung flagships now come with 6” displays and prepaid devices like the LG Stylo 4 and Motorola G7 series help boost mid and low-end sales.
| US Smartphone Market Share (%) | 2018
Q2 | 2018
Q3 | 2018
Q4 | 2019
Q1 | 2019
Q2 |
| Apple | 40% | 39% | 47% | 39% | 41% |
| Samsung | 25% | 25% | 22% | 28% | 21% |
| LG | 16% | 17% | 12% | 11% | 13% |
| Lenovo# | 5% | 8% | 6% | 8% | 8% |
| Other | 14% | 11% | 13% | 14% | 17% |
#Lenovo includes Motorola.
**Ranking is according to the latest quarter.
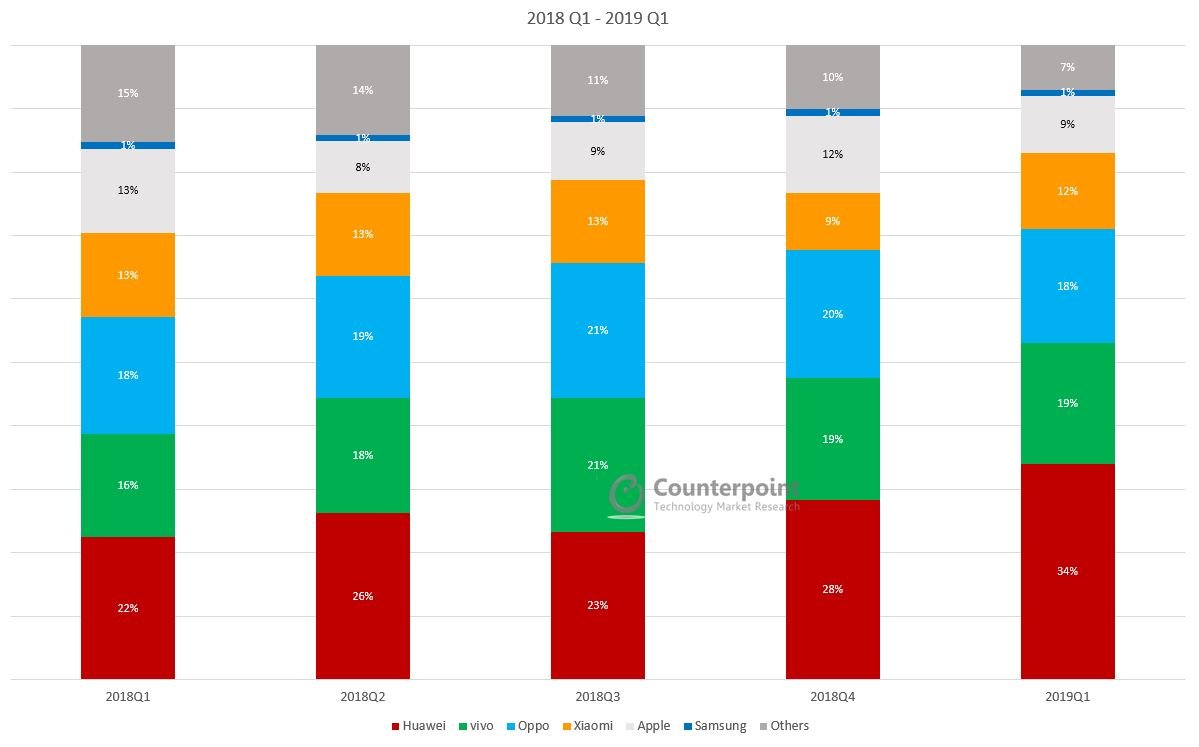
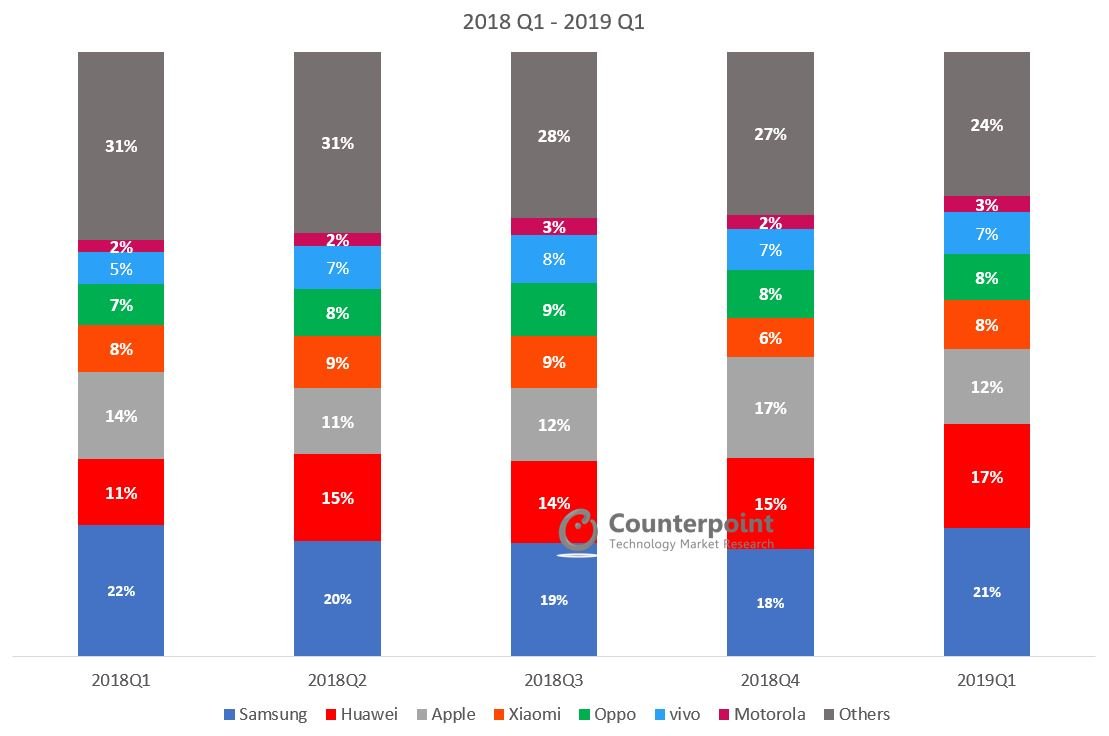
US Smartphone Shipments Market Data (Q1 2018 – Q1 2019)
-
Market Highlights
-
US Smartphone Shipments Market Share (%)
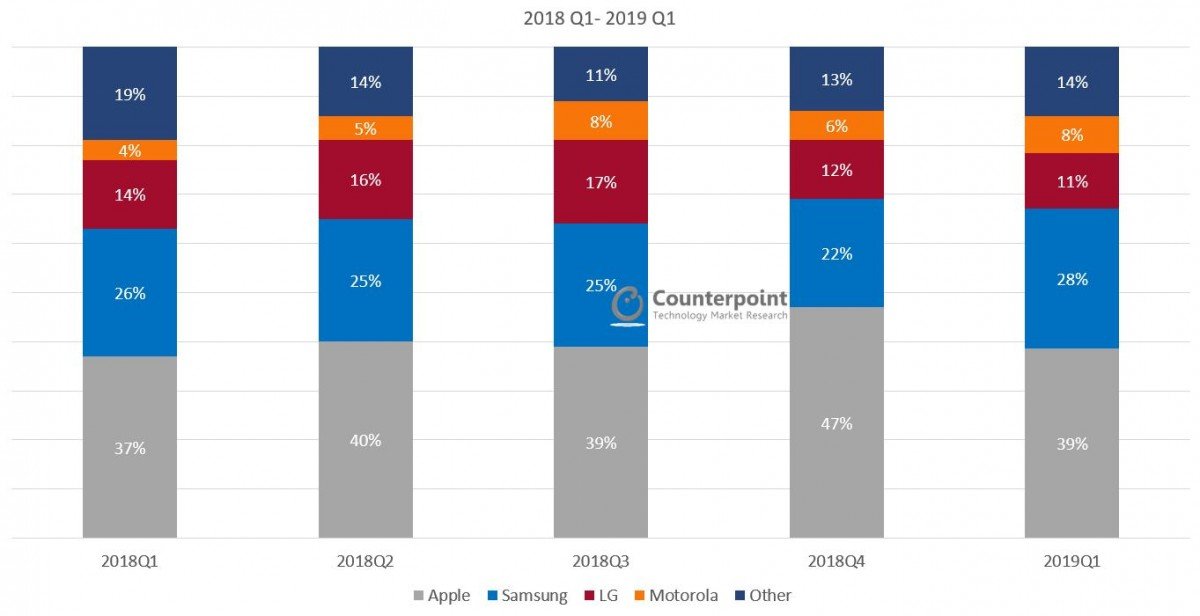
- The US smartphone market is a concentrated market with top 3 brands – Apple, Samsung and LG controlling 78% of the total shipments during the quarter. The market is saturating and replacement cycles are lengthening.
- All the top three brands declined – Apple, Samsung, and LG. Motorola and Google were some of the notable gainers.
- Apple is holding its market share (39%) in a declining US market, but volume mix is shifting to older devices.
| US Smartphone Market Share (%) | 2018
Q1 | 2018
Q2 | 2018
Q3 | 2018
Q4 | 2019
Q1 |
| Apple | 37% | 40% | 39% | 47% | 39% |
| Samsung | 26% | 25% | 25% | 22% | 28% |
| LG | 14% | 16% | 17% | 12% | 11% |
| Motorola | 4% | 5% | 8% | 6% | 8% |
| Other | 19% | 14% | 11% | 13% | 14% |
**Ranking is according to the latest quarter.
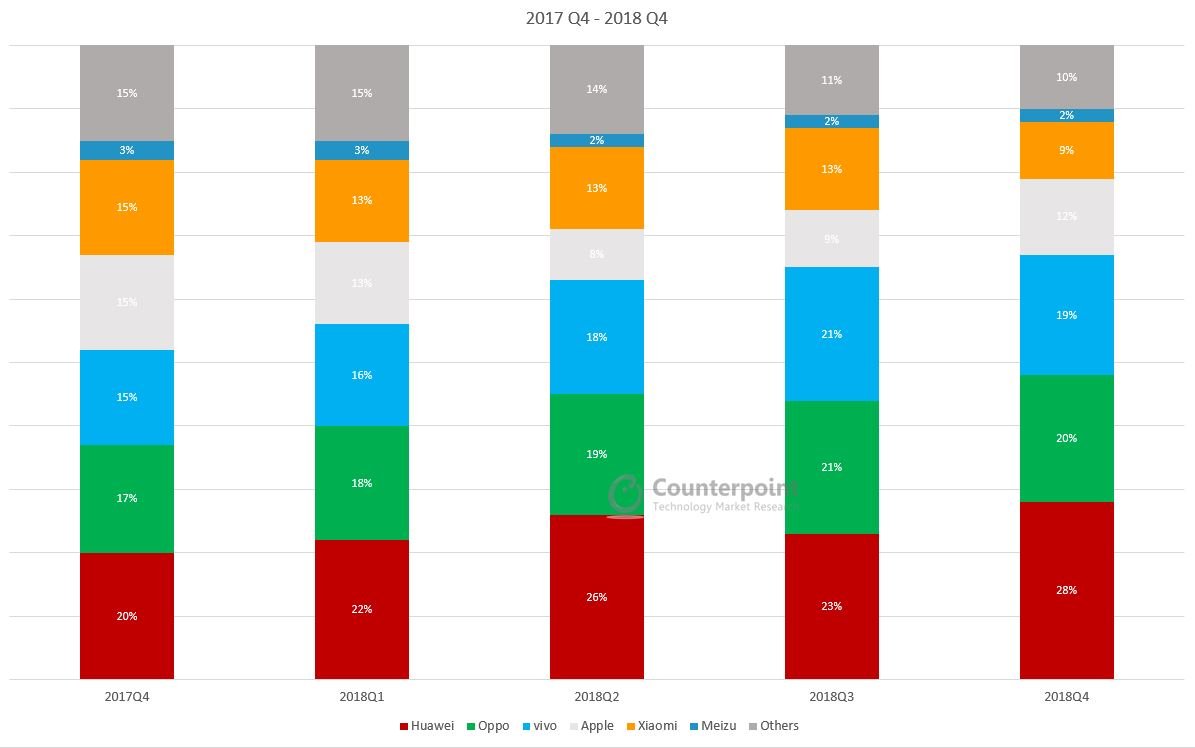
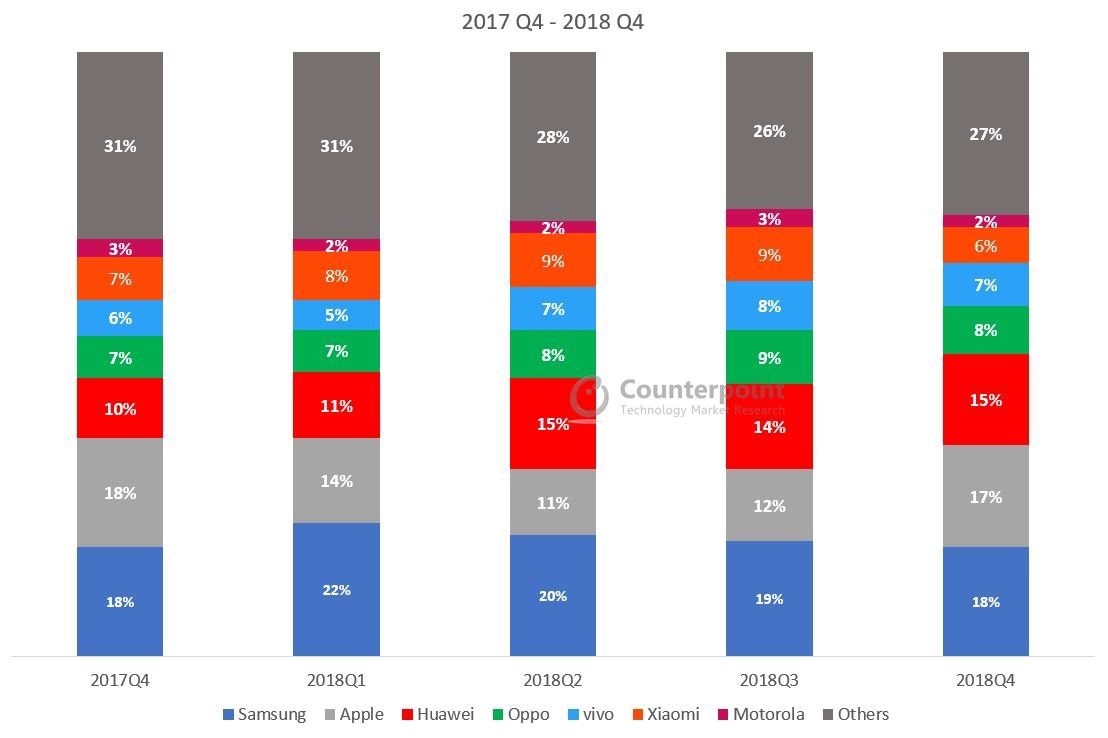
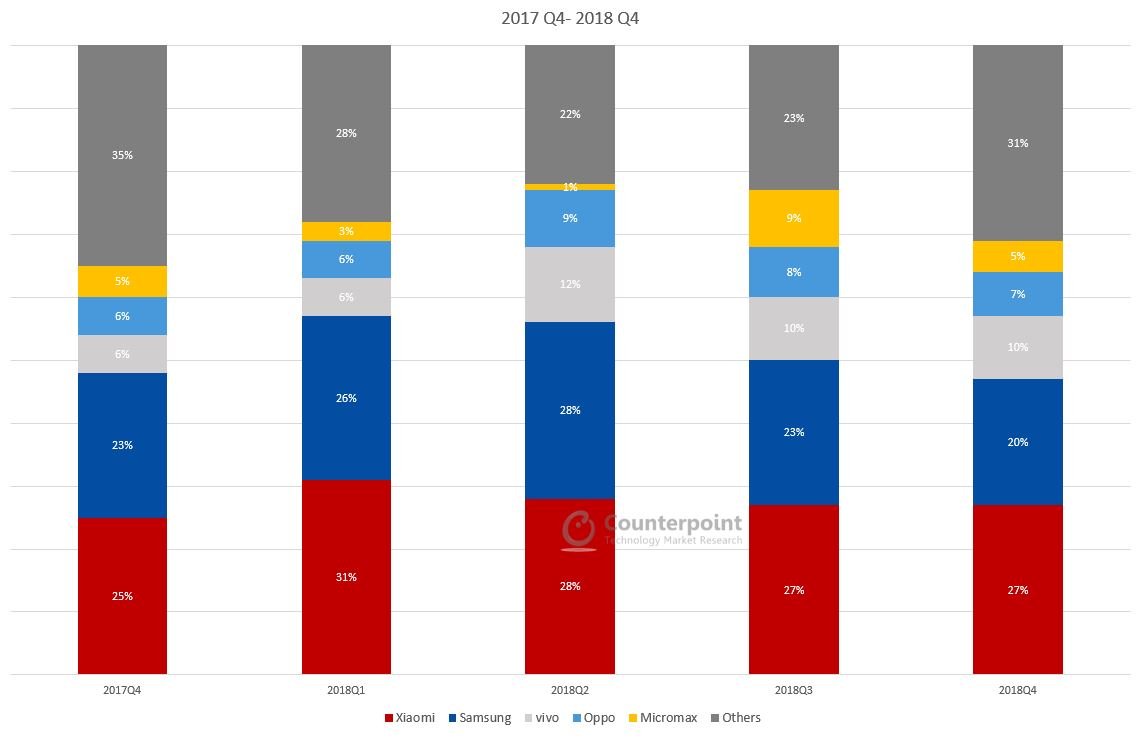
US Smartphone Shipments Market Data (Q4 2017 – Q4 2018)
-
Market Highlights
-
US Smartphone Shipments Market Share (%)
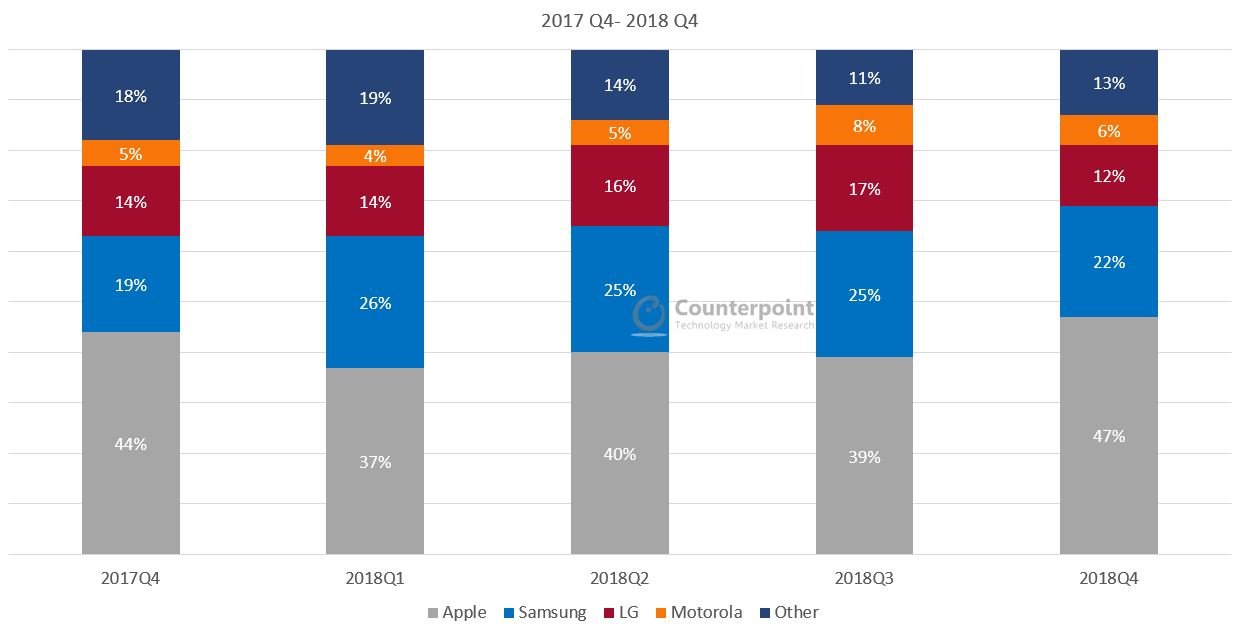
- The US market sold-through 10% fewer smartphones in the fourth quarter of 2018 than the same quarter in 2017.
- Apple: Early adopters hit the stores in September and October to purchase the XS Max and XS. In November and December, the largest volumes moved to the XR.
- Verizon was the largest channel for Apple in 4Q18.
- The only gainers during 4Q18 were Alcatel, Motorola, and Samsung. Alcatel and Motorola grew from small bases.
- Samsung was able to gain on the longevity of the Galaxy S9 and S9 Plus and a particularly strong November for the Note 9. J7 and J3 variants are strong within many prepaid channels.
| US Smartphone Market Share (%) | 2017Q4 | 2018Q1 | 2018Q2 | 2018Q3 | 2018Q4 |
| Apple | 44% | 37% | 40% | 39% | 47% |
| Samsung | 19% | 26% | 25% | 25% | 22% |
| LG | 14% | 14% | 16% | 17% | 12% |
| Motorola | 5% | 4% | 5% | 8% | 6% |
| Other | 18% | 19% | 14% | 11% | 13% |
**Ranking is according to the latest quarter.
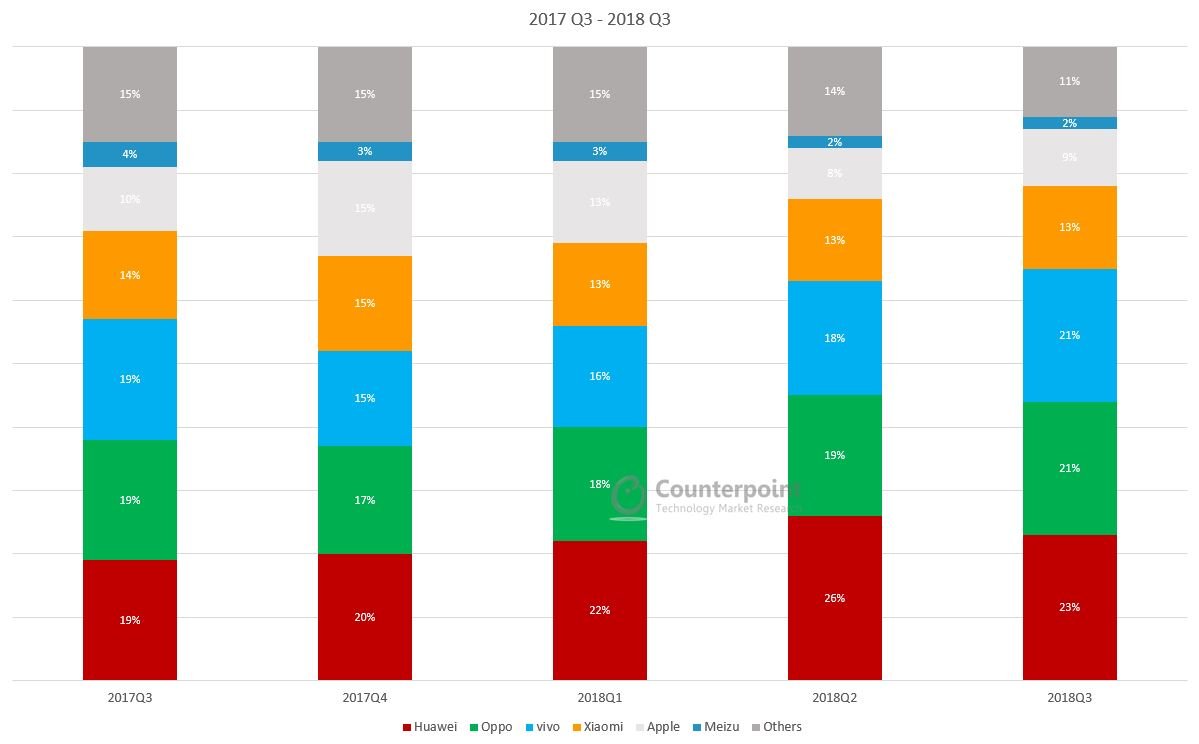
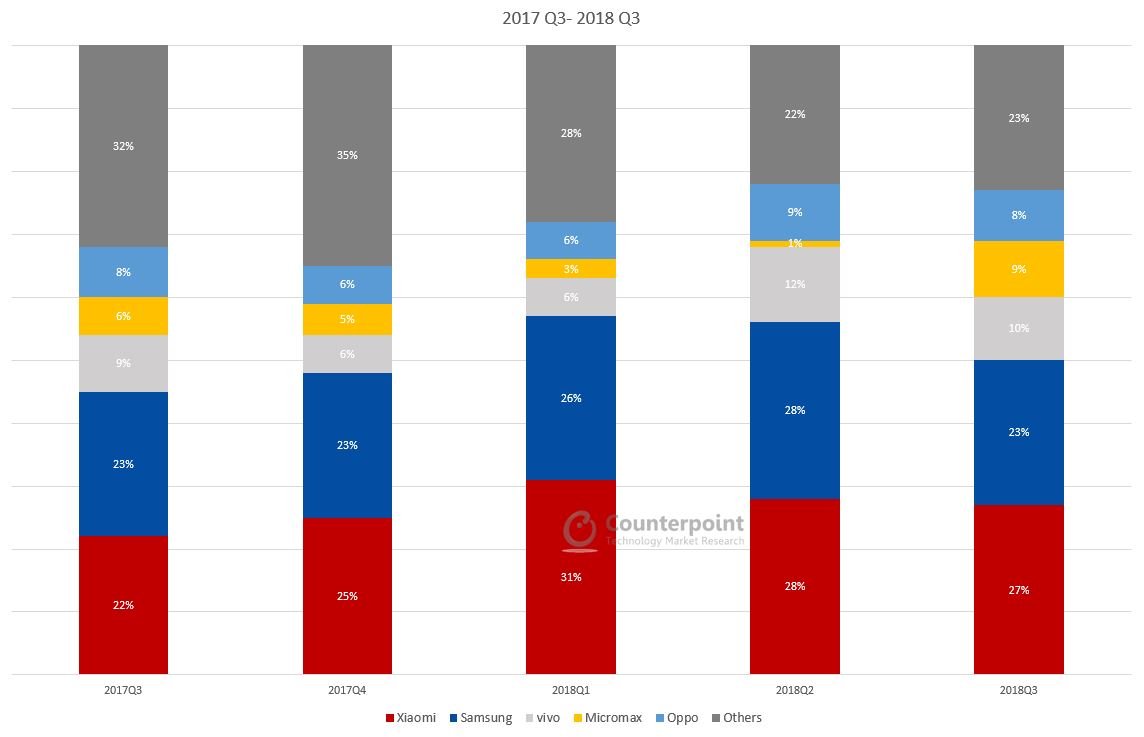
US Smartphone Shipments Market Data (Q3 2017 – Q3 2018)
-
Market Highlights
-
US Smartphone Shipments Market Share (%)
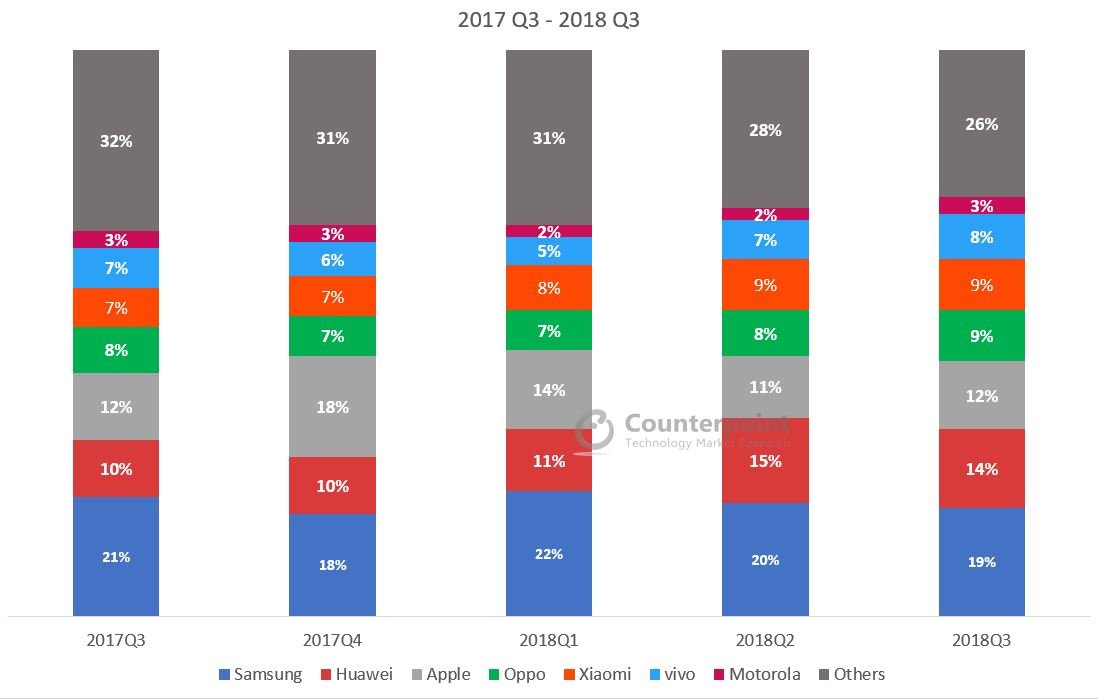
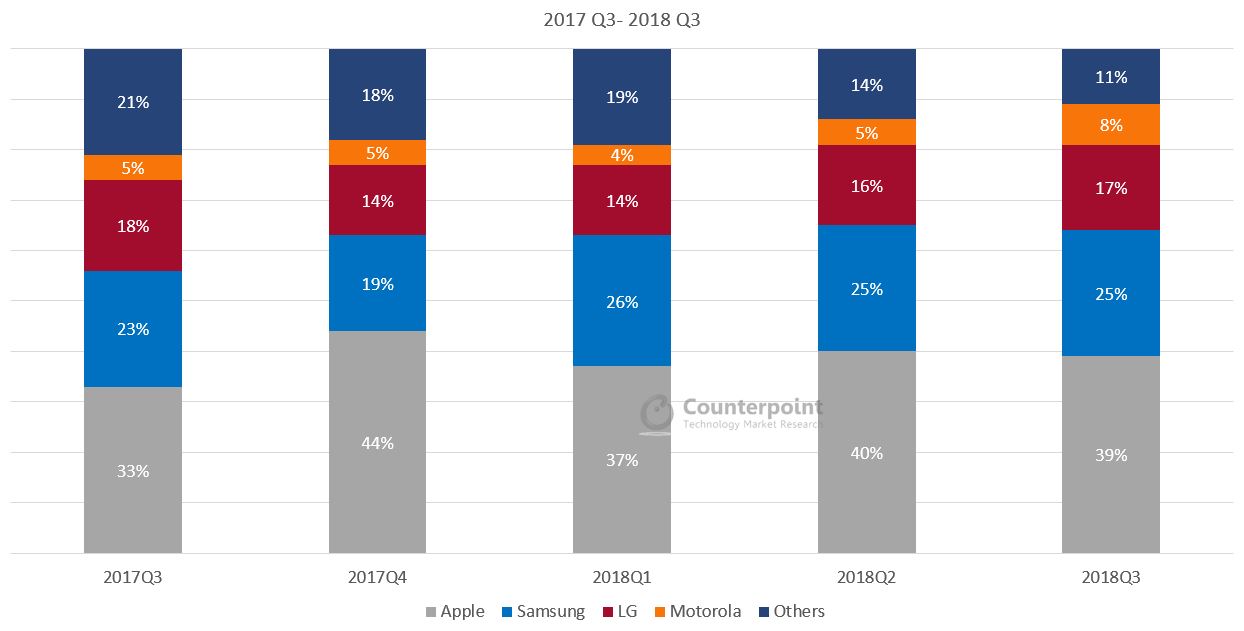
- The USA smartphone market showed an annual decline of 7%.
- Apple is still leading the US Smartphone market with a 39% share in Q3 2018.
- Motorola showed a YoY growth of 54% in Q3 2018.
- Top four brands contributed to about 90% of the total market share.
| US Smartphone Market Share (%) | 2017Q3 | 2017Q4 | 2018Q1 | 2018Q2 | 2018Q3 |
| Apple | 33% | 44% | 37% | 40% | 39% |
| Samsung | 23% | 19% | 26% | 25% | 25% |
| LG | 18% | 14% | 14% | 16% | 17% |
| Motorola | 5% | 5% | 4% | 5% | 8% |
| Others | 21% | 18% | 19% | 14% | 11% |
**Ranking is according to the latest quarter.
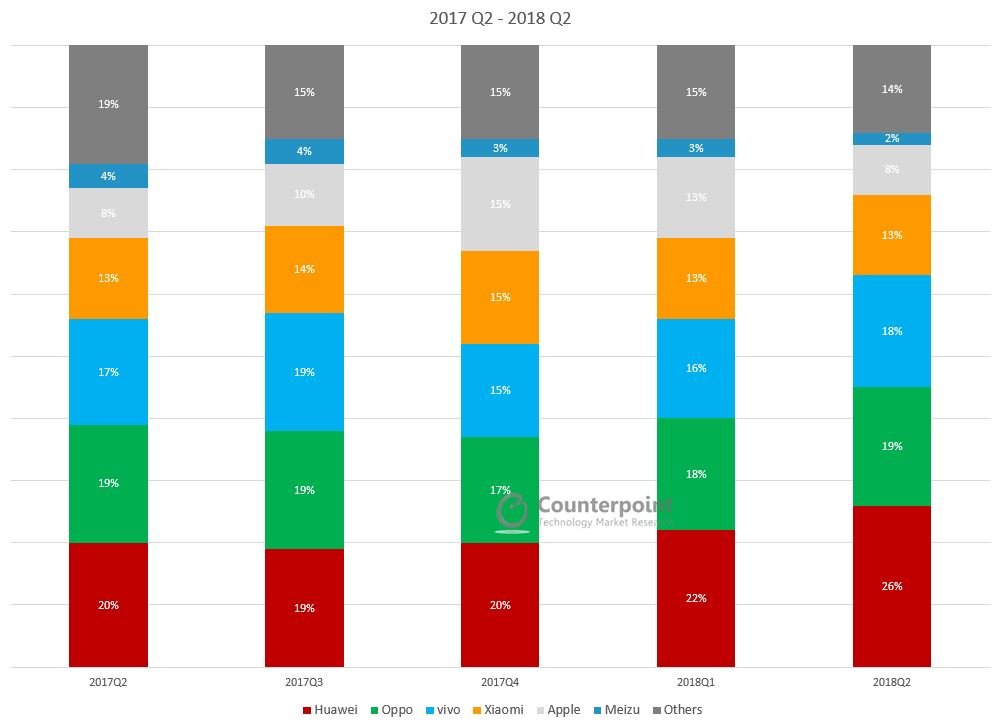
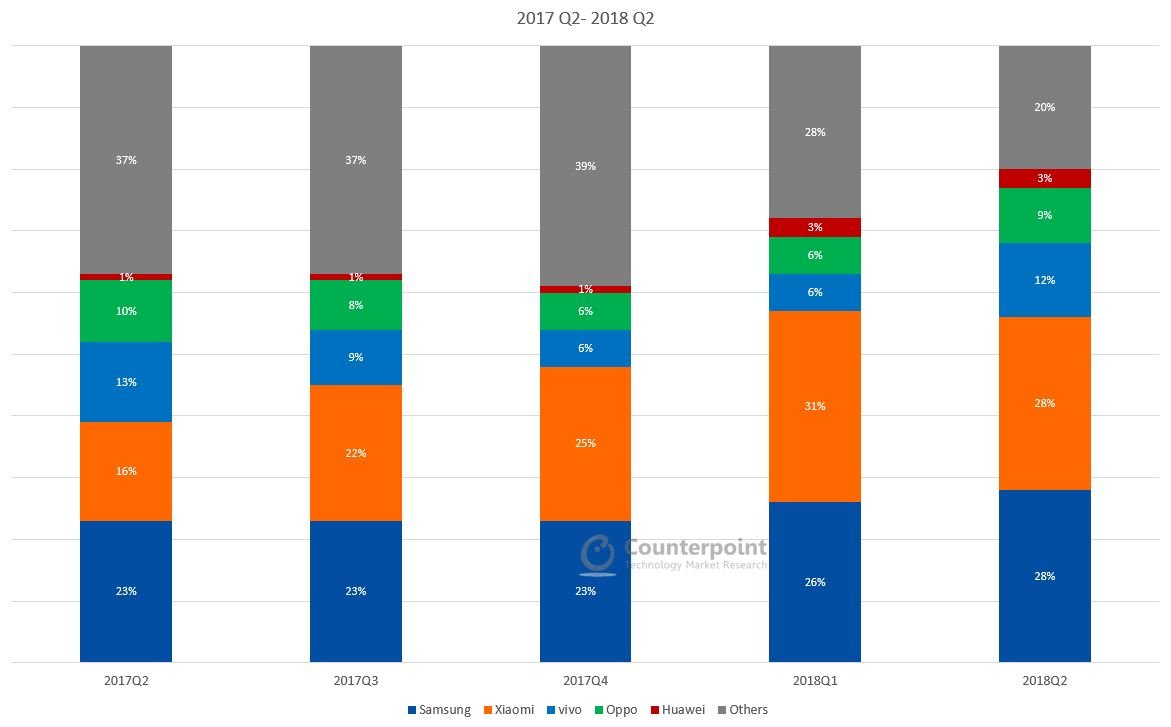
US Smartphone Shipments Market Data (Q2 2017 – Q2 2018)
-
Market Highlights
-
US Smartphone Shipments Market Share (%)
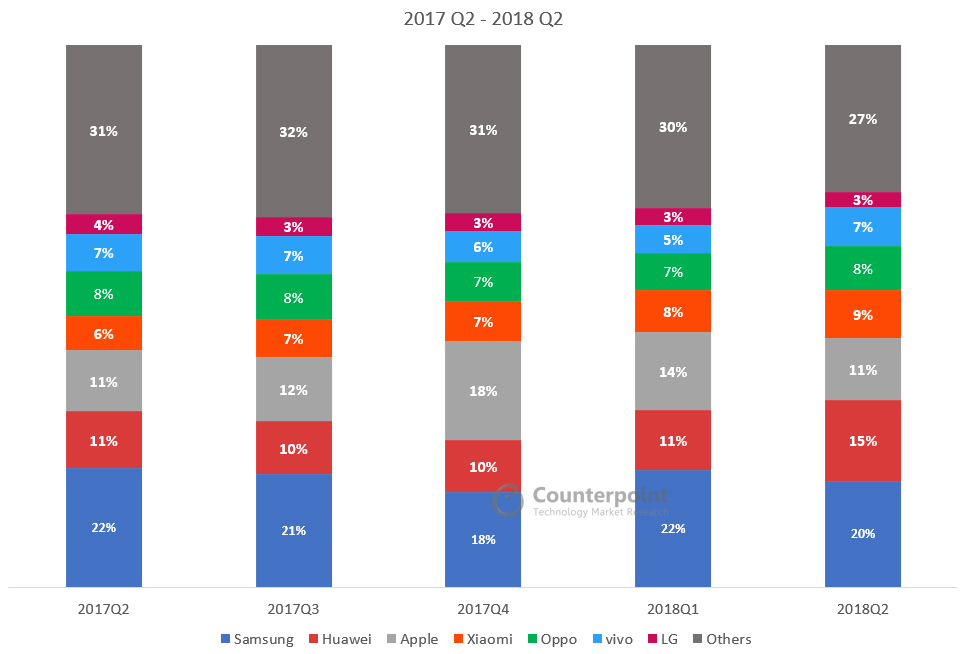
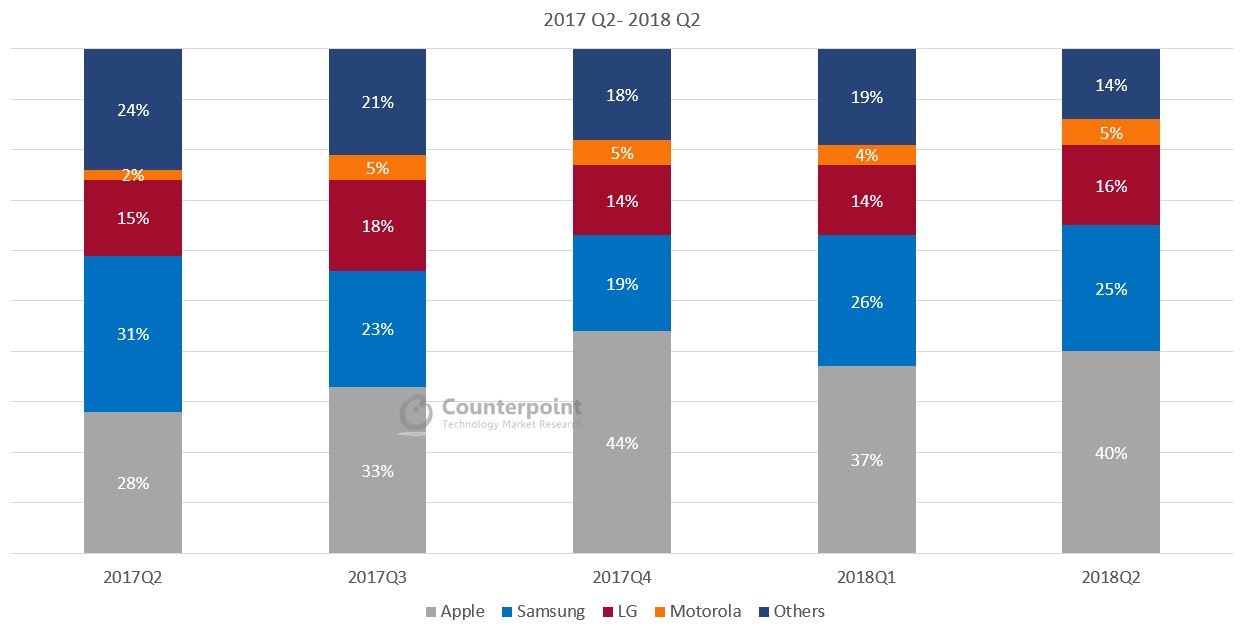
- The US smartphone market declined 22% annually in Q2 2018.
- The decline in the smartphone market was majorly due to ZTE and Samsung. ZTE was affected due to sanctions imposed by the US government.
- Even though device sales were down by double digits, US wireless performances were solid in Q2 2018.
| US Smartphone Market Share (%) | 2017Q2 | 2017Q3 | 2017Q4 | 2018Q1 | 2018Q2 |
| Apple | 28% | 33% | 44% | 37% | 40% |
| Samsung | 31% | 23% | 19% | 26% | 25% |
| LG | 15% | 18% | 14% | 14% | 16% |
| Motorola | 2% | 5% | 5% | 4% | 5% |
| Others | 24% | 21% | 18% | 19% | 14% |
**Ranking is according to the latest quarter.
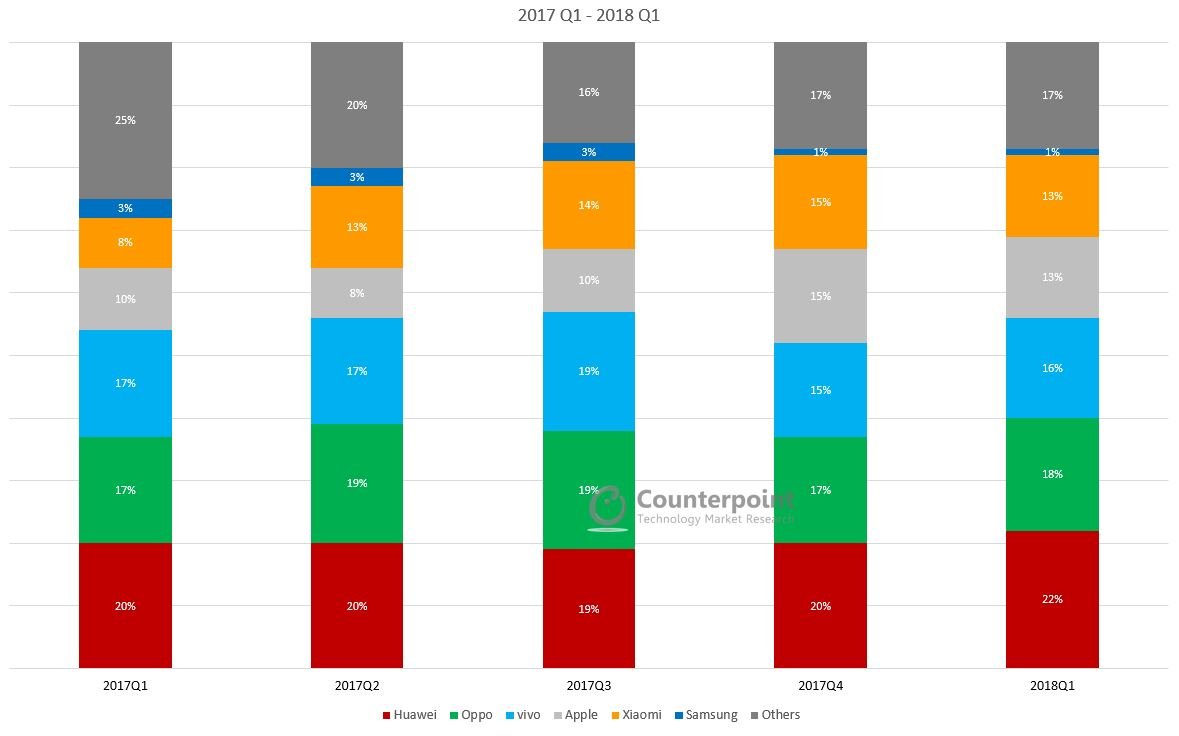
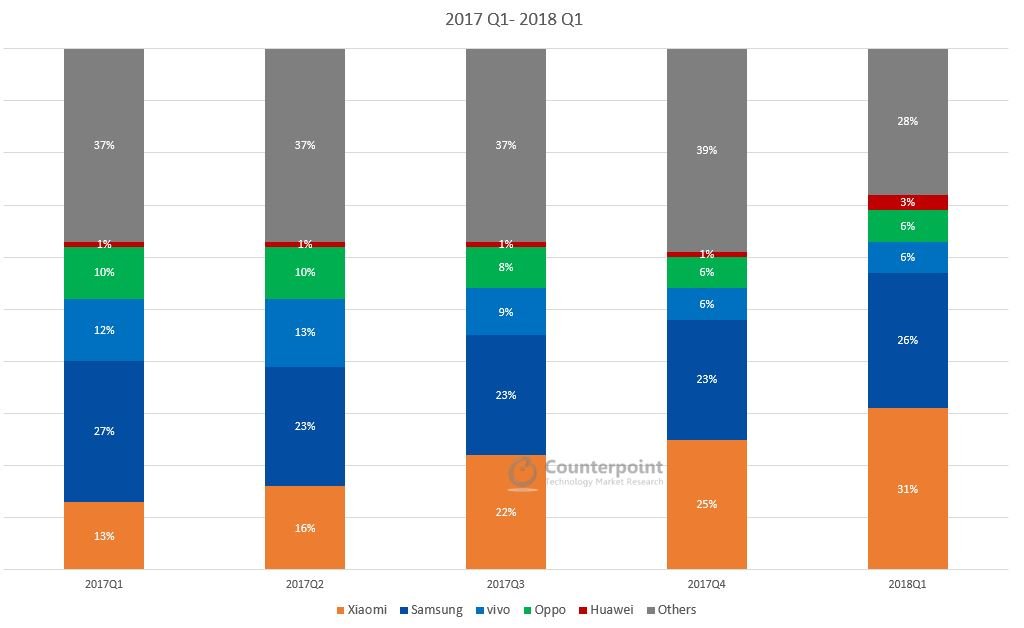
US Smartphone Shipments Market Data (Q1 2017 – Q1 2018)
-
Market Highlights
-
US Smartphone Shipments Market Share (%)
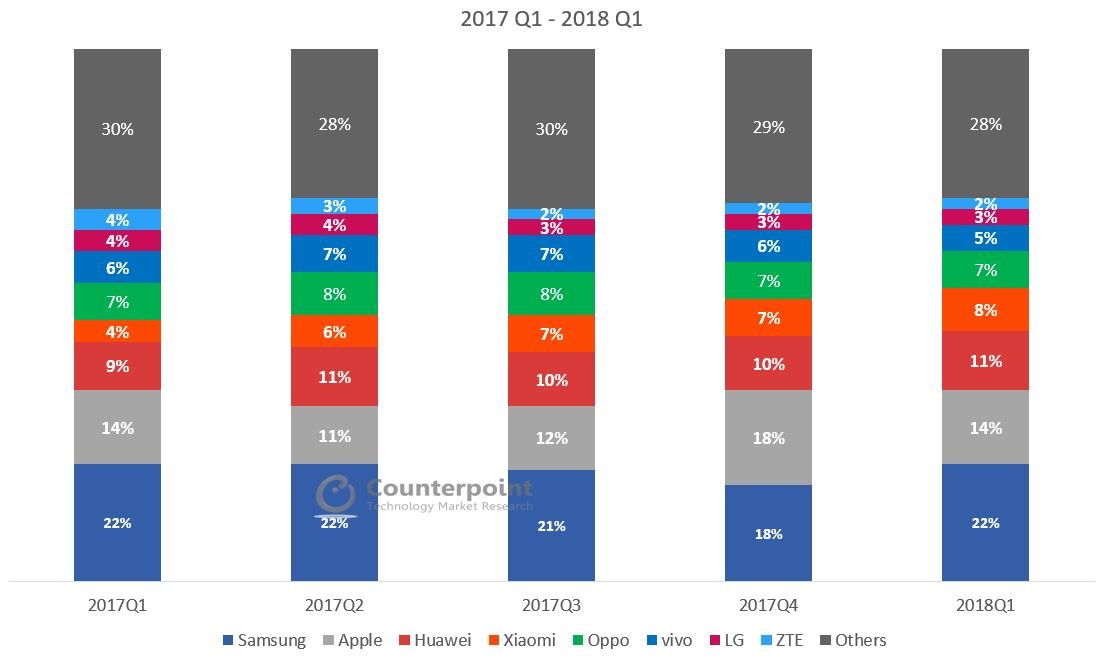
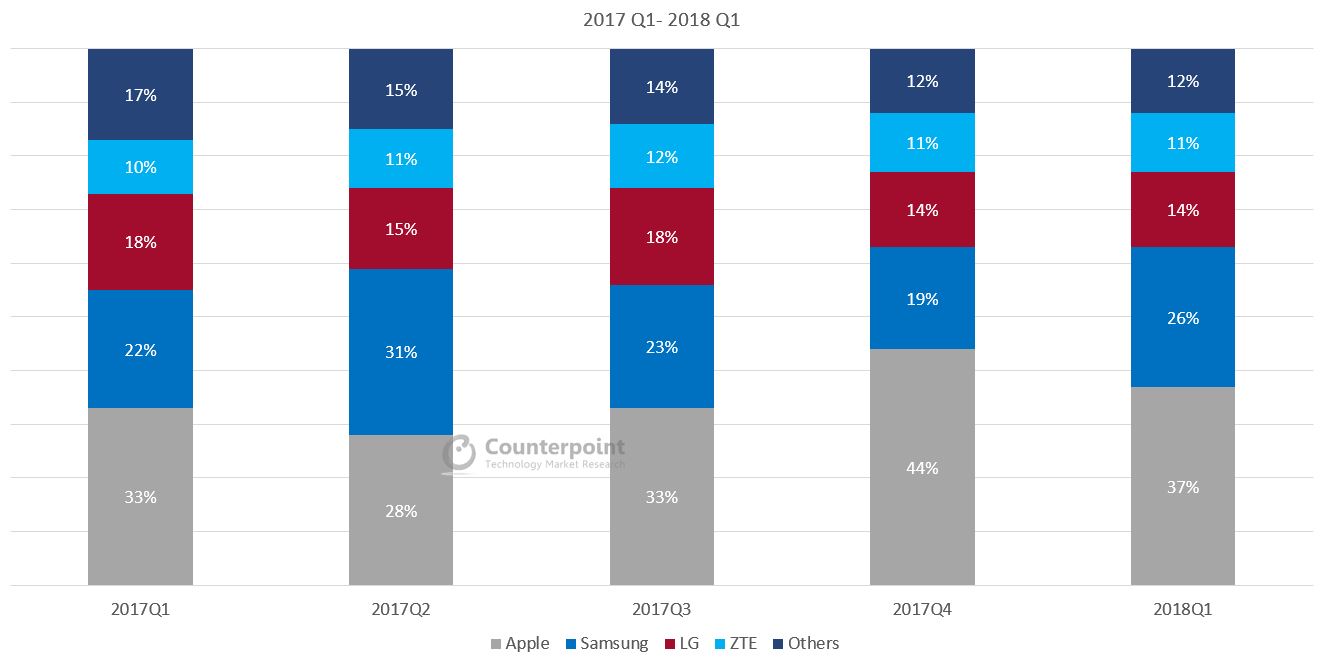
- The US smartphone market declined by 1% in Q1 2018 compared to Q1 2017
- Apple continued to dominate the smartphone market with 38% share and grew annually because the iPhone X performed well in the market
- LG declined annually due to a shift in its flagship smartphone launch strategy
| US Smartphone Market Share (%) | 2017Q1 | 2017Q2 | 2017Q3 | 2017Q4 | 2018Q1 |
| Apple | 33% | 28% | 33% | 44% | 37% |
| Samsung | 22% | 31% | 23% | 19% | 26% |
| LG | 18% | 15% | 18% | 14% | 14% |
| ZTE | 10% | 11% | 12% | 11% | 11% |
| Others | 17% | 15% | 14% | 12% | 12% |
**Ranking is according to the latest quarter.