
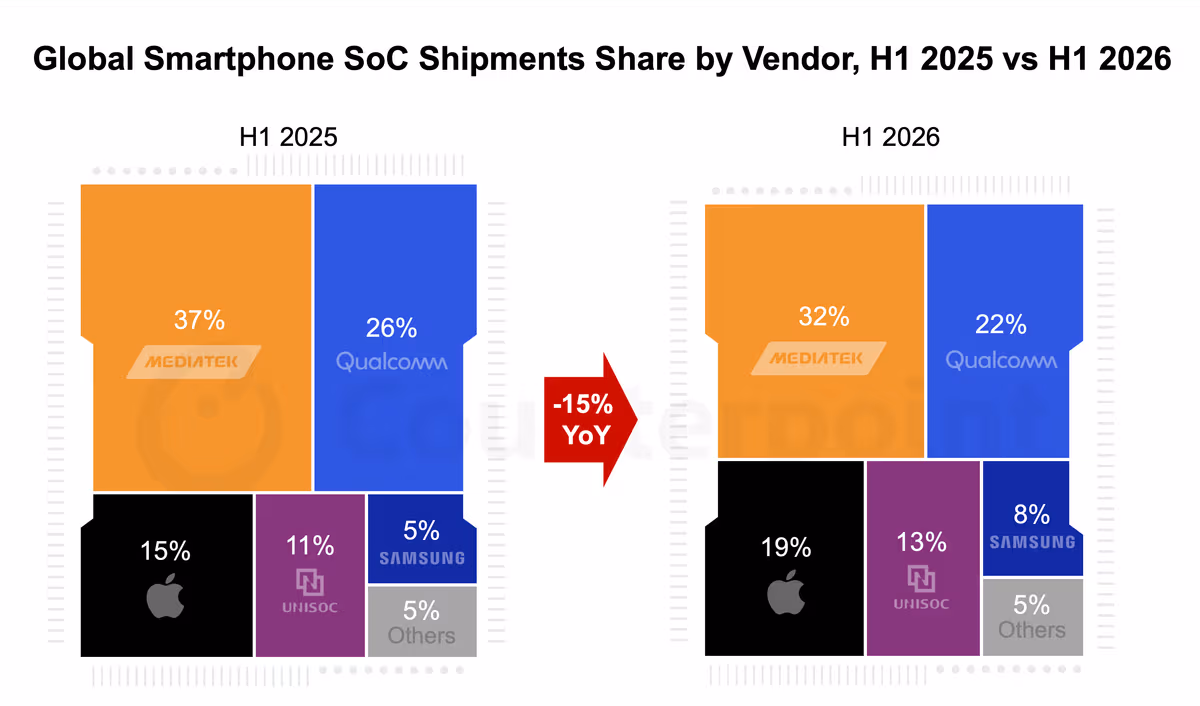
Global Smartphone SoC Shipments Fall 15% YoY in H1 2026 Amid Rising Memory Costs
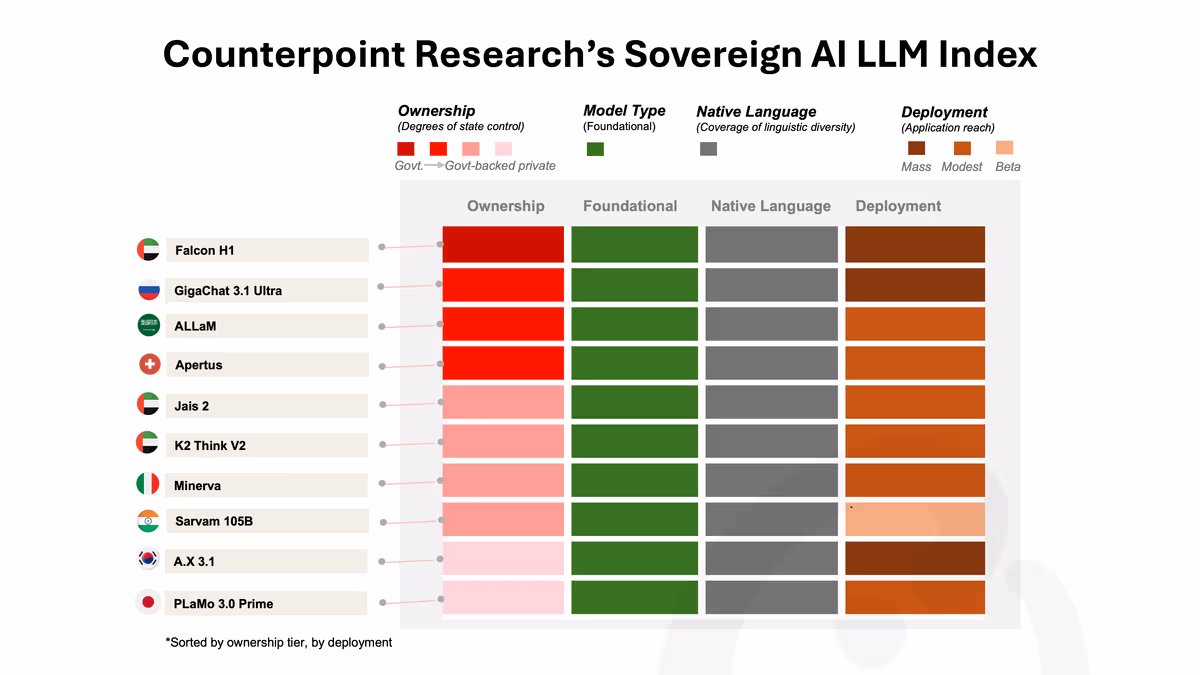
Middle East Leads Sovereign AI LLM Race in H1 2026 as UAE’s Falcon H1 Tops Counterpoint’s Sovereign AI Index
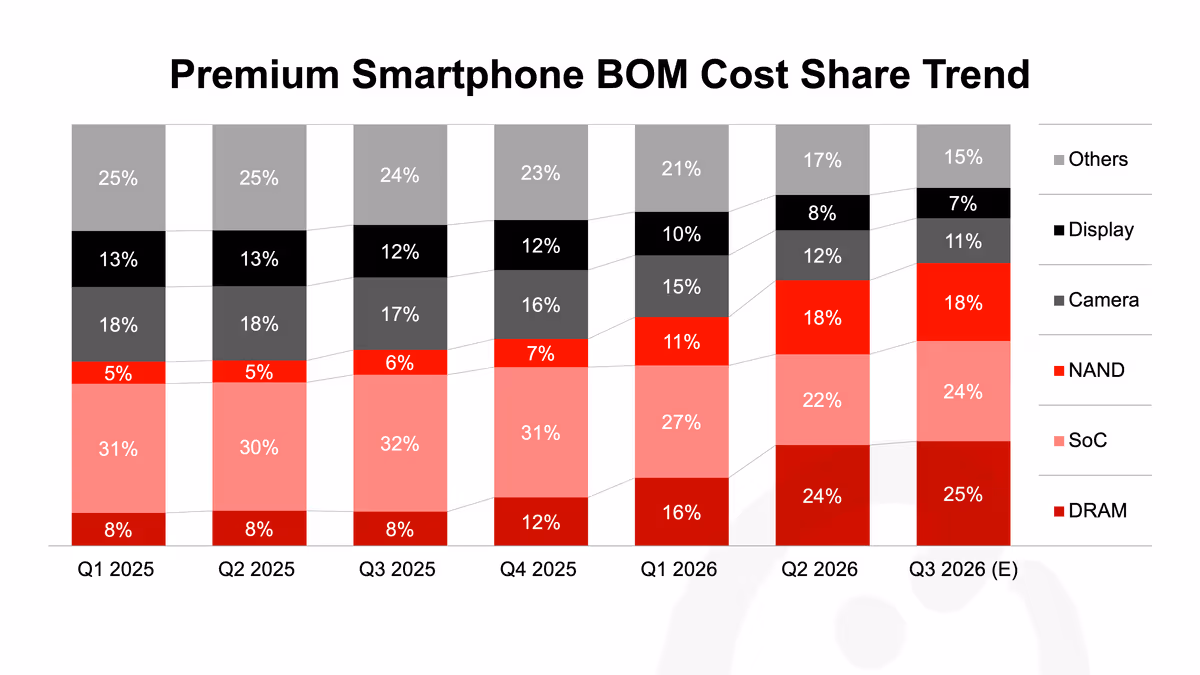
Reshuffling the BoM - Component Cost Dynamics Amid Memory Price Spikes
Counterpoint Smartphone Intelligence Tracker, July 2026
Overview: The July edition of Counterpoint’s monthly Smartphone Intelligence Tracker offers the Counterpoint perspective on a curated collection of recent news and other articles that have made an impact on the smartphone ecosystem (OEMs, app ecosystem, policy, and more). It gives readers an idea of the current state of affairs in the sector and potential ramifications, helping connect the dots....
Global Smartphone SoC Model Shipments Tracker - Q2 2026 (Preliminary View)
Overview: This report tracks smartphone SoC shipments at the model level across all major vendors. The scope includes key chipset vendors such as Apple, Qualcomm, MediaTek, Hisilicon, Samsung, UNISOC, and Google. The analysis covers more than 350 SoC models from Q1 2020 to Q2 2026, along with a one-quarter forecast for Q3 2026. The report provides a detailed view of the SoC market from a shipment perspective and also analyses the market by price tier for each vendor. In addition, the report includes key technical specifications for these chipsets, such as SoC core architecture, foundry relationships, process node, manufacturing technology, modem support, secure element integration, AI accelerator capabilities, GPU configuration, and connectivity technologies....
Memory Solutions for Gen AI Part 36: 10 Findings with No End in Sight
Smartphone OEMs are struggling either with elevated component prices or with securing sufficient memory supply. NVIDIA’s moves, however, appear driven by a different logic: maximizing the number of CPUs and GPUs shipped within a constrained supply environment....
US Smartphone Channel Share Tracker Monthly Report, June 2026
Overview: This report analyzes the US smartphone market: model level sell through volumes by OEM, sales channel along with price bands. It dives further into OEM performance insights and carrier promotions. The sales channels covered in the report include Verizon, AT&T, T-Mobile, Spectrum, Xfinity, Cricket, Metro by T-Mobile, Boost, Verizon Prepaid, Best-buy, Walmart, Target, Amazon and USA OEM. This is additional analysis accompanying the model level database of US Monthly Smartphone Sell-through by Channel....
Receive our insightful weekly newsletter and stay ahead of the competition.
Recent Analysis by Coverage Area
Our Clients


Client Testimonials
Global Research Manager
Apple
The way you contextualize things is unique, informative and actionable. The team will be coming back for more.
Strategic Marketing Manager
Samsung Electronics
The data and analysis provided by Counterpoint is unparalleled in terms of granularity and preciseness. We did not hesitate to choose Counterpoint after the initial briefings. The client support is also excellent, very approachable.
Marketing Director
Amazon
Counterpoint’s insight on the market is way more detailed. It’s an eye-opener for us compared to other firms.
Corporate Strategy Manager
HERE
Counterpoint’s strengths are their clear and far-sighted insights into the market for connected devices and ecosystems. They actively ensure they maintain a detailed understanding of HERE’s capability and strategy. This combination means their insights offer real value to our business and are widely appreciated across our business.
Corporate Strategy Manager
SK Telecom
We reach out to Counterpoint whenever we hit a block in the road. Every time the team delivers the most up to date and accurate answers to our questions. We always feel we have a long term advisor and partner to trust in.