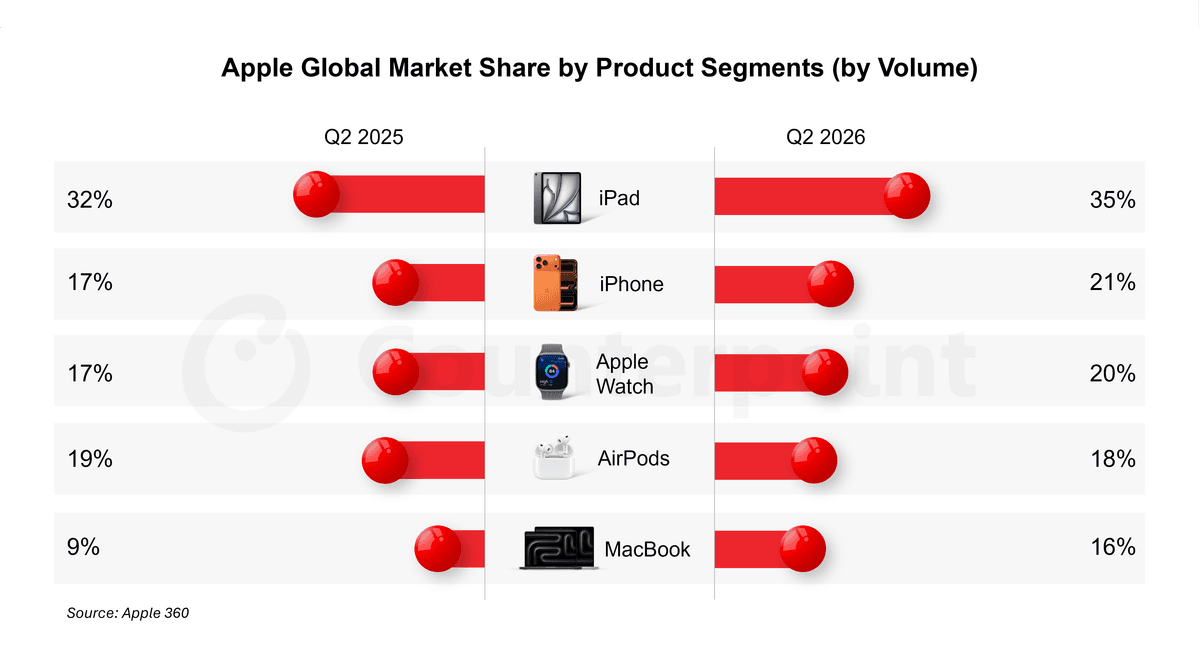
Apple Global Market Share by Product Segments (by Volume)
| Global Market Share | Q2 2025 | Q2 2026 |
|---|---|---|
| iPad | 32% | 35% |
|
AirPods |
19% | 18% |
|
Apple Watch |
17% | 20% |
|
iPhone |
17% | 21% |
| MacBook | 9% | 16% |
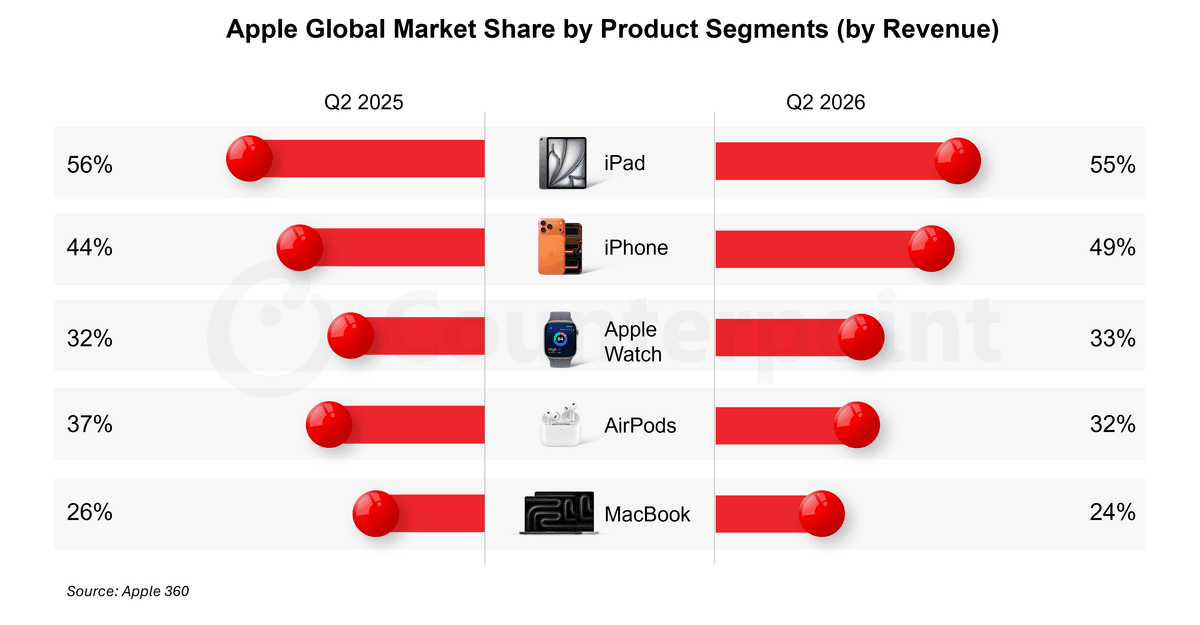
Apple Global Market Share by Product Segments (by Revenue)
| Global Market Share | Q2 2025 | Q2 2026 |
|---|---|---|
| iPad | 56% | 55% |
|
AirPods |
37% | 32% |
| Apple Watch | 32% | 33% |
|
iPhone |
44% | 49% |
| MacBook | 26% | 24% |
Market Highlights Q2 2026
- iPhone revenue grew 22% YoY to $54 billion in Q2 2026, setting another June-quarter record. Growth was driven by continued strength of the iPhone 17 series, which remained among the best-performing smartphone lineups globally, alongside resilient premium demand across several key markets. Apple also largely avoided the broad-based smartphone price increases seen across competing portfolios during the quarter, further supporting shipment momentum.
- Furthermore, iPhones shipments grew by 13% YoY during the quarter due to strong performance of the iPhone 17 series, particularly the base iPhone 17 and iPhone 17 Pro Max, which kept the mix skewed toward premium models.
- Apple also largely avoided the broad-based smartphone price increase while competitors raised prices by 15%-20% during the quarter. This price stability, combined with aggressive shipments particularly in China, helped Apple support demand and position for market share gains
- Mac revenues and shipments grew 29% and 30% YoY during the quarter setting a June quarter revenue record despite significant supply constraints because of successful launch of MacBook Neo. However, the introduction of the lower-priced MacBook Neo led to a roughly 1% YoY decrease in ASP.
- iPad revenue and shipments declined 6% and 4% YoY, respectively, mainly due to a high comparison base from the iPad 11th generation launch in Q2 2025. The decline was partly cushioned by the iPad Air gaining importance in the portfolio, while ASP declined only 2% as higher component costs and pricing adjustments partly offset the normalization of premium mix.
- Apple Watch shipments grew 14% YoY in Q2 2026, while revenue increased 8% YoY. This growth was driven by continued adoption of last year’s upgraded Apple Watch portfolio, including the Series 11, SE 3, and Ultra 3. However, ASP declined by 6% YoY was primarily driven by the Apple Watch SE 3, which accounted for nearly one-third of total Q2 2026 shipments.
- AirPods shipment declined by 1% while Revenue & ASP grew by 3% and 5%. Growth was supported by a richer product mix, driven by the addition of a new Pro model.
- Apple’s services revenue grew 12% YoY, reaching $30.7 billion, a June quarter record. The growth was lower than expected due to foreign exchange headwinds and a slowdown in gaming and the App Store.
The global Apple market share numbers are from:
Apple 360: Hardware and Services Revenue Splits by Segment and Region Q2 2026
Excel File | Published Date: August 2026
This report, part of Counterpoint Research’s quarterly Apple 360 series, provides a comprehensive overview of Apple’s hardware and Services revenue by segment and region, highlighting the growing contribution of Services to the company’s overall performance.


