
Q3 2026 Highlights
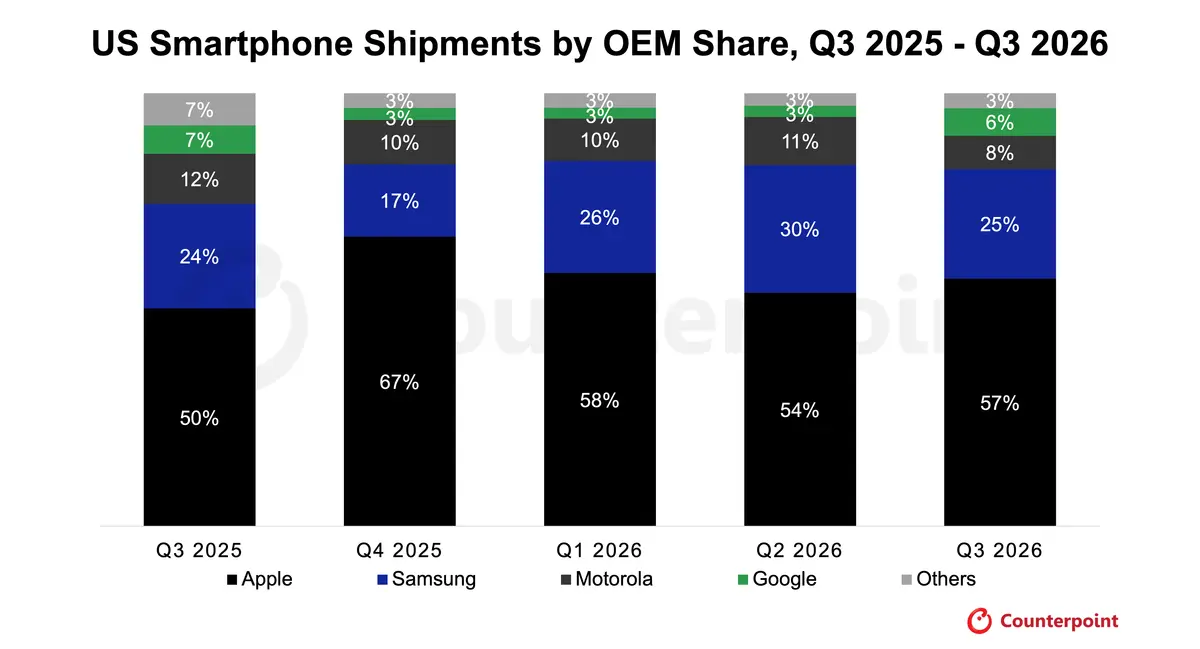
US Smartphone Shipments Market Share (%)
| Brands | Q3 2025 | Q4 2025 | Q1 2026 | Q2 2026 | Q3 2026 |
| Apple | 50% | 67 % | 58 % | 54 % | 57 % |
| Samsung | 24 % | 17 % | 26 % | 30 % | 25 % |
| Motorola | 12 % | 10 % | 10 % | 11 % | 8 % |
| 7 % | 3 % | 3 % | 3 % | 6 % | |
| Others | 7 % | 3 % | 3 % | 3 % | 3 % |
**Ranking is according to the latest quarter
Data on this page is updated every quarter
This data represents the global smartphone market share by quarter (from 2023-2026) by top OEMs. Global smartphone shipments by market share and millions of units are provided.
For detailed insights on the data, please reach out to us at [email protected]. If you are a member of the press, please contact us at [email protected] for any media enquiries.
Market Highlights
- US smartphone shipments declined 9% YoY in Q3 2026, as global memory constraints affected Android shipments, especially low-end OEMs.
- Apple's shipment share was increased 7% points YoY and 3% QoQ as it was the only OEM not affected by shipment declines in the US market.
- Samsung grew its share 1% point YoY and declined 5% points QoQ. Due to Samsung's dual strategy of flagship models and low-end A-series devices, the OEM was able to diversify a bit more than other OEMs resulting in lower YoY growth losses compared to other OEMs.
- Motorola's shipment share declined by 4% point YoY. After Motorola had positive shipment growth YoY in Q2, the OEM saw shipments decline as its low-end smartphone models are getting squeezed due to rising memory costs.
- Google's shipment share decreased by 1% point YoY but grew 3% QoQ. Google's Pixel 11 series launch helped the OEM grow share QoQ but shipments were weaker YoY.
These smartphone market share numbers are from:
Market Monitor - OEM Shipment by Region and Countries, Q3 2026
Excel File | Published Date: November 2026
This report is part of a series of market monitor reports which track the mobile handset market: Smartphone and Feature Phone shipments every quarter for more than 140 brands covering more than 97% of the total device shipments in the industry.
Read more Contact us
Q2 2026 Highlights
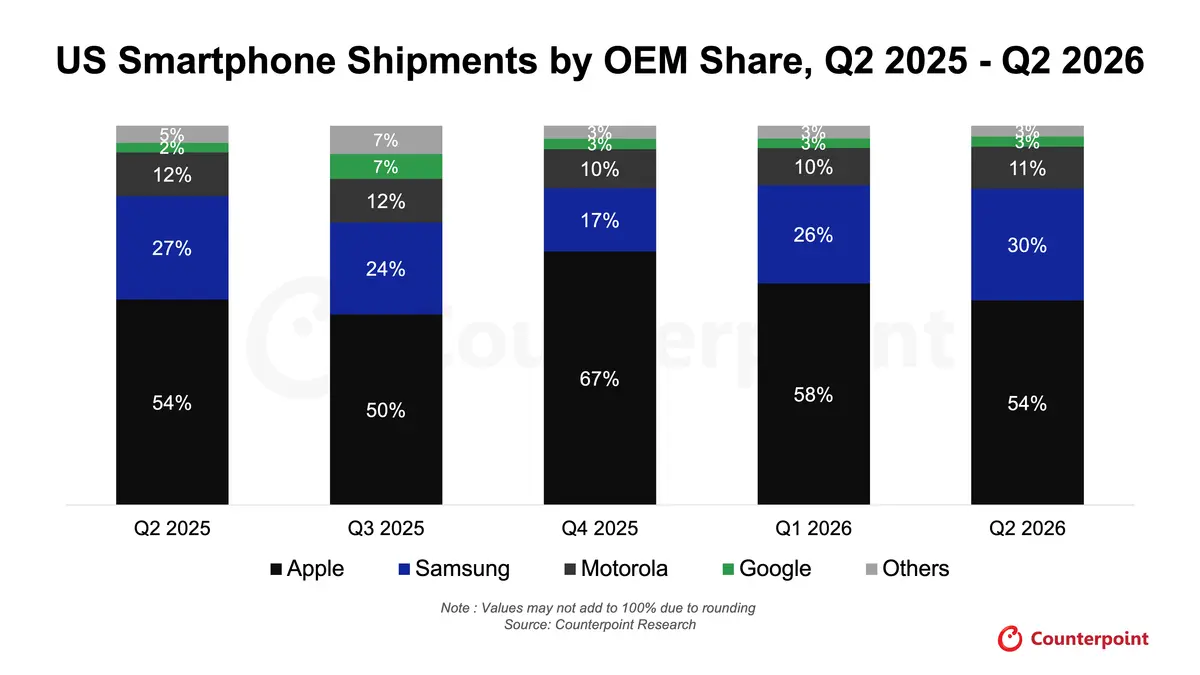
US Smartphone Shipments Market Share (%)
| BRANDS | Q2 2025 | Q3 2025 | Q4 2025 | Q1 2026 | Q2 2026 |
| Apple | 54% | 50% | 67% | 58% | 54% |
| Samsung | 27% | 24% | 17% | 26% | 30% |
| Motorola | 12% | 12% | 10% | 10% | 11% |
| 2% | 7% | 3% | 3% | 3% | |
| Others | 5% | 7% | 3% | 3% | 3% |
**Ranking is according to the latest quarter
Data on this page is updated every quarter
This data represents the global smartphone market share by quarter (from 2023-2026) by top OEMs. Global smartphone shipments by market share and millions of units are provided.
For detailed insights on the data, please reach out to us at [email protected]. If you are a member of the press, please contact us at [email protected] for any media enquiries.
Market Highlights
- US smartphone shipments grew 6% YoY in Q2 2026, as global memory constraints are pushing shipment volumes higher ahead of further RAM/NAND price increases.
- Apple's shipment share was flat YoY but down 4% points QoQ as volumes decreased after the launch of the 17e during Q1.
- Samsung grew its share 3% point YoY and 4% points QoQ. The OEM is heavily shipping A17 5G units to get ahead of memory price increases.
- Motorola's shipment share declined by 1% point YoY. Prepaid demand remained weak but the OEM is maintaining double digit shipment share as it competes with Samsung in the low-end market.
- Google's shipment share increased by 1% point YoY and was flat QoQ. Google's Pixel brand remains aggressive in postpaid, with the OEM growing its shipment units YoY as it is able to gain adequate memory components from its suppliers.
These smartphone market share numbers are from:
Market Monitor - OEM Shipment by Region and Countries, Q2 2026
Excel File | Published Date: August 2026
This report is part of a series of market monitor reports which track the mobile handset market: Smartphone and Feature Phone shipments every quarter for more than 140 brands covering more than 97% of the total device shipments in the industry.
Read more Contact us
Q1 2026 Highlights
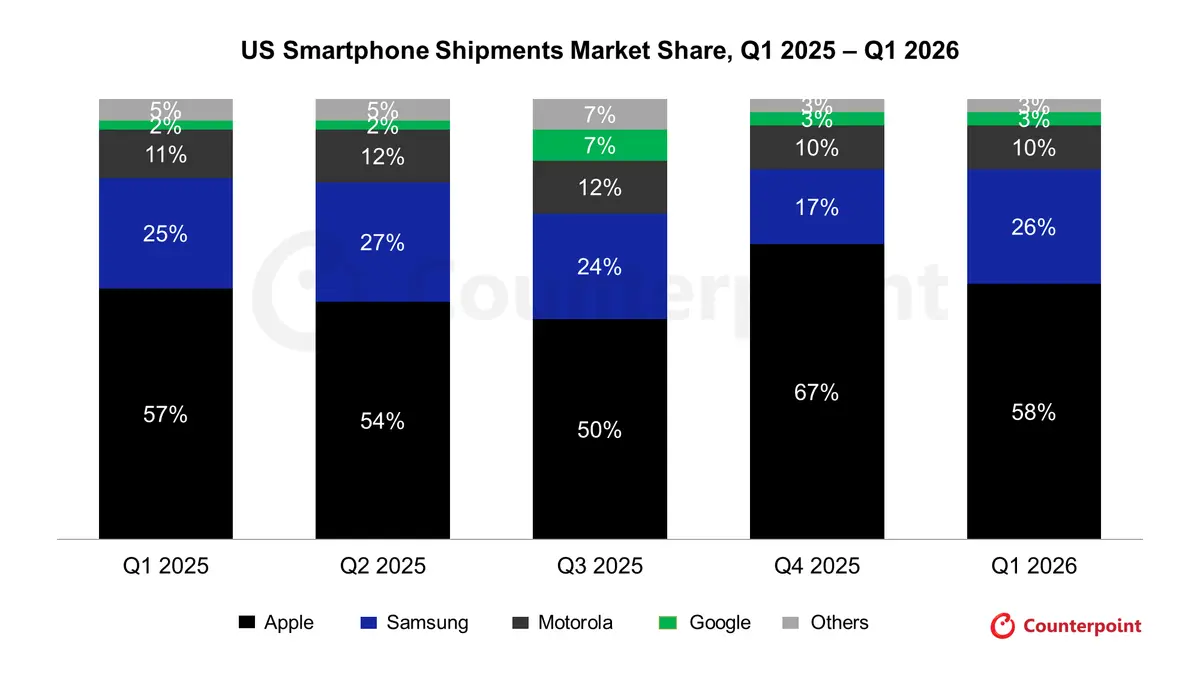
US Smartphone Shipments Market Share (%)
| BRANDS | Q1 2025 | Q2 2025 | Q3 2025 | Q4 2025 | Q1 2026 |
|---|---|---|---|---|---|
| Apple | 57% | 54% | 50% | 67% | 58% |
| Samsung | 25% | 27% | 24% | 17% | 26% |
| Motorola | 11% | 12% | 12% | 10% | 10% |
| 2% | 2% | 7% | 3% | 3% | |
| Others | 5% | 5% | 7% | 3% | 3% |
**Ranking is according to the latest quarter
Data on this page is updated every quarter
This data represents the global smartphone market share by quarter (from 2023-2026) by top OEMs. Global smartphone shipments by market share and millions of units are provided.
For detailed insights on the data, please reach out to us at [email protected]. If you are a member of the press, please contact us at [email protected] for any media enquiries.
Market Highlights
- US smartphone shipments contracted 3% YoY in Q1 2026, mainly due to unfavorable YoY comparisons from the end-of-Q1 2025 tariff-related sell-in surges, combined with weaker low-end shipments this year driven by the global memory shortage, particularly LPDDR4X constraints.
- Apple's shipment share was up by 1% point YoY but down 9% points QoQ due to typical seasonality. iPhone 17 shipments remained strong as Q4 2025 experienced some shortages, helping the YoY share gain.
- Samsung grew its share 1% point YoY and 9% points QoQ. The later S26 series launch helped Samsung maintain strong volumes in Q1.
- Motorola's shipment share declined by 1% point YoY. Prepaid demand remained weak but the OEM continued to push this space with earlier launches, flooding the market with new SKUs as other OEMs struggle to maintain volumes due to macroeconomic and political factors.
- Google's shipment share grew by 1% point YoY and remained flattish QoQ. Google has gained some ground in the premium space, along with a successful launch of the Pixel 10a.
These smartphone market share numbers are from:
Market Monitor - OEM Shipment by Region and Countries, Q1 2026
Excel File | Published Date: May 2026
This report is part of a series of reports which track the mobile handset market: Smartphone and Feature Phone shipments every quarter for more than 140 brands covering more than 97% of the total device shipments in the industry.
Read more Contact us
Q4 2025 Highlights

US Smartphone Shipments Market Share (%)
| BRANDS | Q4 2024 | Q1 2025 | Q2 2025 | Q3 2025 | Q4 2025 |
|---|---|---|---|---|---|
| Apple | 65% | 57% | 54% | 50% | 67% |
| Samsung | 18% | 25% | 27% | 24% | 17% |
| Motorola | 10% | 11% | 12% | 12% | 10% |
| Others | 7% | 7% | 7% | 14% | 6% |
Market Highlights
- Smartphone shipments in the US grew 8% YoY in Q4 2025, driven by strong Apple shipments. Concerns over tariff-related impacts proved wrong as the overall US market grew YoY in 2025 as well.
- Apple's shipment share grew to an all-time high of 67% in Q4 as the iPhone 17 series was very well received by consumers. Shipping wait times remained elevated throughout Q4 compared to the iPhone 16 series in the previous year.
- Samsung's share declined slightly by 1% due to Apple's strength in the quarter. It also faced pressure from Google in the premium segment, as well as Motorola in prepaid channels.
- Motorola's shipments maintained sales share YoY and grew in double digits YoY as it strategically launched new g 2026 series devices in the quarter.
- HMD has exited the US market, and we have ended tracking of the OEM with the Q4 data.
Q3 2025 Highlights

Market Highlights
- Smartphone shipments in the US were up slightly YoY in Q3 2025 despite ongoing tariff concerns. While imports from China declined, those from other regions like Vietnam and India increased, resulting in overall shipment growth in the quarter.
- Apple’s shipment share again declined both YoY and QoQ, but the OEM remained up in terms of YTD shipments due to the strong performance of iPhone 16e shipments earlier in the year. Shipments for the iPhone 17 series have been solid but are facing challenges from strong demand.
- Samsung grew its share modestly YoY, up one basis point but down three basis points QoQ. This was because Google saw strong increases in shipments both YoY and QoQ.
- Motorola saw some weakness in Q3 as prepaid demand was low due to macroeconomic and political factors, resulting in both YoY and QoQ share declines.
- HMD has exited the US market, and we will end tracking of the OEM by the end of the year.
US Smartphone Shipments Market Share (%)
| Brands | Q2 2024 | Q3 2024 | Q4 2024 | Q1 2025 | Q2 2025 | Q3 2025 |
|---|---|---|---|---|---|---|
| Apple | 52% | 53% | 65% | 57% | 54% | 50% |
| Samsung | 24% | 23% | 18% | 25% | 27% | 24% |
| Motorola | 12% | 14% | 10% | 11% | 12% | 12% |
| HMD | 1% | 1% | 0% | 0% | 0% | 0% |
| Others | 11% | 9% | 7% | 7% | 7% | 14% |
Q2 2025 Highlights

Market Highlights
- Smartphone shipments in the US grew 2% YoY in Q2 2025 despite tariffs being announced in April. While imports from China declined, those from other regions like Vietnam and India increased, resulting in overall shipment growth in the quarter.
- Apple's shipment share declined both QoQ and YoY as Android shipments increased at a higher rate than iOS in the quarter.
- Samsung had double-digit YoY growth, which resulted in a higher market share, up 3 basis points to 27%, due to improved premium device shipments in the quarter.
- Motorola saw its fifth consecutive quarter of double-digit market share as it continued to pressure other prepaid-focused OEMs while also launching its RAZR 2025 series in May compared to July last year, helping shipments grow.
- HMD has announced it will exit the US market, which will leave opportunities for other OEMs to gain share.
Q1 2025 Highlights

Market Highlights
- Smartphone shipments grew 9% YoY in Q1 2025 due to efforts, especially in March, to circumvent potential tariff-related impacts.
- Apple achieved its highest Q1 shipment share to date at 57% due to the launch of the iPhone 16e, combined with the front-loading of shipments ahead of April.
- Samsung's share declined to 25% from 31% in Q1 2024, partially due to Apple's shipment increase, and also due to lower S25 shipments YoY.
- Motorola also had its biggest shipment share ever in Q1 at 11%, driven by an earlier launch of its G-series line-up in 2025 and improved positioning in prepaid, especially as HMD continued to show weakness in this segment.
US Smartphone Shipments Market Share (%)
| Brands | Q4 2023 | Q1 2024 | Q2 2024 | Q3 2024 | Q4 2024 | Q1 2025 |
|---|---|---|---|---|---|---|
| Apple | 62% | 52% | 52% | 53% | 65% | 57% |
| Samsung | 17% | 31% | 24% | 23% | 18% | 25% |
| Motorola | 9% | 9% | 12% | 14% | 10% | 11% |
| HMD | 2% | 2% | 1% | 1% | 0% | 0% |
| Others | 10% | 6% | 11% | 9% | 7% | 7% |
Q4 2024 Highlights

Market Highlights
- In Q4 2024, US smartphone sell-in decreased 9% YoY as demand continued to be impacted by low upgrade rates and long upgrade cycles.
- Apple’s shipments were down 5% YoY as the iPhone 16's performance was not as strong as expected. The late launch of Apple Intelligence also impacted the numbers.
- Samsung’s sell-in decreased 4% YoY, as prepaid demand slowed in Q4 combined with slightly less demand for premium devices YoY.
- Motorola increased 4% YoY primarily due to an improved prepaid positioning compared to other OEMs like HMD, which saw a loss in share.
- Google’s shipments increased 1% YoY due to larger shipments of devices as the Pixel 9 series has four SKUs compared to the Pixel 8 series' two SKUs.
US Smartphone Shipments Market Share (%)
| Brands | Q3 2023 | Q4 2023 | Q1 2024 | Q2 2024 | Q3 2024 | Q4 2024 |
|---|---|---|---|---|---|---|
| Apple | 53% | 62% | 52% | 52% | 53% | 65% |
| Samsung | 25% | 17% | 31% | 24% | 23% | 18% |
| Motorola | 11% | 9% | 9% | 12% | 14% | 10% |
| HMD | 2% | 2% | 2% | 1% | 1% | 0% |
| Others | 9% | 10% | 6% | 11% | 9% | 7% |
Q3 2024 Highlights

Market Highlights
- US smartphone sell-in in Q3 2024 decreased 6% YoY due to weak demand in both prepaid and postpaid channels.
- Apple’s shipments were down 5% YoY with weaker sales impacting the OEM during the quarter.
- Samsung’s sell-in decreased 13% YoY, as the Z series launched in July this year, with initial shipments arriving in June.
- Motorola increased 21% YoY primarily due to an improved prepaid performance from the Moto G Play 2024, resulting in the biggest market share shift across major OEMs.
- Google’s shipments increased 19% YoY due to an earlier launch of the Pixel 9 series compared to the Pixel 8 which launched in October.
US Smartphone Shipments Market Share (%)
| Brands | Q2 2023 | Q3 2023 | Q4 2023 | Q1 2024 | Q2 2024 | Q3 2024 |
|---|---|---|---|---|---|---|
| Apple | 55% | 53% | 62% | 52% | 52% | 53% |
| Samsung | 23% | 25% | 17% | 31% | 24% | 23% |
| Motorola | 9% | 11% | 9% | 9% | 12% | 14% |
| HMD | 2% | 2% | 2% | 2% | 1% | 1% |
| Others | 11% | 9% | 10% | 6% | 11% | 9% |
Q2 2024 Highlights

US Smartphone Shipments Market Share (%)
| Brands | Q1 2023 | Q2 2023 | Q3 2023 | Q4 2023 | Q1 2024 | Q2 2024 |
|---|---|---|---|---|---|---|
| Apple | 52% | 55% | 53% | 62% | 52% | 52% |
| Samsung | 27% | 23% | 25% | 17% | 31% | 24% |
| Motorola | 8% | 9% | 11% | 9% | 9% | 12% |
| HMD | 1% | 2% | 2% | 2% | 2% | 1% |
| Others | 12% | 11% | 9% | 10% | 6% | 11% |
Market Highlights
• US smartphone shipments declined 2% YoY in Q2 2024, the seventh consecutive quarter showing a YoY decline. Continued record low upgrade rates are causing the declines.
• Apple’s market share remained flat at 52% QoQ but declined 3% YoY. There is anticipation that Apple Intelligence will help boost sales in H2 2024 for the OEM.
• Samsung’s market share decline to 24% from the high of 31% in Q1 2024. After initial strong sales for the S24 series, momentum stalled and the OEM saw additional competition from Motorola in the prepaid segment.
• Motorola's share grew to double digits again as it continued to make gains with its 2024 G series line-up in prepaid. The Motorola RAZR 2023 also saw success in the Big Three prepaid carriers as it was discounted to $150 in promotion for switchers.
• HMD lost share in Q2 as older models in prepaid channels went EOL without a replacement.
Q1 2024 Highlights

US Smartphone Shipments Market Share (%)
| Brands | Q4 2022 | Q1 2023 | Q2 2023 | Q3 2023 | Q4 2023 | Q1 2024 |
|---|---|---|---|---|---|---|
| Apple | 59% | 52% | 55% | 53% | 62% | 52% |
| Samsung | 19% | 27% | 23% | 25% | 17% | 31% |
| Motorola | 6% | 8% | 9% | 11% | 9% | 9% |
| HMD | 1% | 1% | 2% | 2% | 2% | 2% |
| Others | 15% | 12% | 11% | 9% | 10% | 6% |
Q4 2023 Highlights

Market Highlights
• US smartphone shipments declined YoY for the fifth straight quarter in Q4 2023 despite end-of-year holiday demand. Carriers continued to cite weak upgrade rates and long holding periods as reasons for the underperformance.
• Apple’s shipment share grew to 62% in Q4 as the OEM was less impacted by weak market dynamics due to the iPhone 15 launch in September.
• Samsung’s share declined YoY to 17%. It saw increased shipments due to the S24 launch in late January but low-end A-series shipments declined.
• Motorola’s share grew, partially due to some increases in premium devices, especially the RAZR 2023.
• Google’s share declined to 3% as Pixel sales were weaker YoY.
• In “others”, Nokia HMD continued to gain share due to a stronger channel presence in prepaid.
US Smartphone Shipments Market Share (%)
| Brands | Q3 2022 | Q4 2022 | Q1 2023 | Q2 2023 | Q3 2023 | Q4 2023 |
|---|---|---|---|---|---|---|
| Apple | 50% | 59% | 52% | 55% | 53% | 62% |
| Samsung | 24% | 19% | 27% | 23% | 25% | 17% |
| Motorola | 6% | 6% | 8% | 9% | 11% | 9% |
| 4% | 5% | 2% | 3% | 3% | 3% | |
| Others | 16% | 11% | 11% | 10% | 8% | 9% |
**Ranking is according to the latest quarter.
Q3 2023 Highlights

Market Highlights
• US smartphone shipments declined YoY for the fourth straight quarter in Q3 2023 amid weak consumer demand.
• Google, Samsung and TCL were among the brands recording the steepest YoY declines, while Motorola and Nokia HMD managed growth amid a challenging market environment. Motorola increased its shipment share to 11% in Q3.
• Apple’s iPhone shipments declined 11% YoY, in part due to the later launch date of the iPhone 15 series compared to the iPhone 14 series. Its sales share dropped to 53% in Q3 from 55% in Q2.
• Weak upgrade rates at the carriers were the main source of weak smartphone shipments, signaling that consumers are opting to hold on to their devices for longer.
US Smartphone Shipments Market Share (%)
| Brands | Q2 2022 | Q3 2022 | Q4 2022 | Q1 2023 | Q2 2023 | Q3 2023 |
|---|---|---|---|---|---|---|
| Apple | 48% | 50% | 57% | 52% | 55% | 53% |
| Samsung | 30% | 24% | 20% | 27% | 23% | 25% |
| Motorola | 9% | 6% | 6% | 8% | 9% | 11% |
| 1% | 4% | 5% | 2% | 3% | 3% | |
| Others | 12% | 16% | 12% | 11% | 10% | 8% |
**Ranking is according to the latest quarter.
Q2 2023 Highlights

Market Highlights
• US smartphone shipments declined 24% YoY. Low-end smartphone sale declines were the biggest contributing factor to the downturn.
• Samsung’s shares dropped to 23% as competition from other Android OEMs has increased in the prepaid segment, hurt Samsung’s performance.
• Apple was one of the few OEMs that did not see a shipments drop of double digits YoY. Older iPhone 11 and iPhone 12 devices are helping the OEM attract new customers.
• Google’s share rose to 3% due to the earlier launch of the Pixel 7a compared to its predecessor.
• Motorola grew to 9% share capitalizing on Samsung’s weakness, launching new devices including the G Stylus, G 5G and the new Razr+ in Q2.
US Smartphone Shipments Market Share (%)
| Brands | Q1 2022 | Q2 2022 | Q3 2022 | Q4 2022 | Q1 2023 | Q2 2023 |
|---|---|---|---|---|---|---|
| Apple | 50% | 48% | 50% | 57% | 52% | 55% |
| Samsung | 24% | 30% | 24% | 20% | 27% | 23% |
| Motorola | 11% | 9% | 6% | 6% | 8% | 9% |
| 2% | 1% | 4% | 5% | 2% | 3% | |
| Others | 13% | 12% | 16% | 12% | 11% | 10% |
**Ranking is according to the latest quarter.
Q1 2023 Highlights

Market Highlights
• US smartphone shipments declined 17% YoY in Q1 2023 due to inventory correction and weak consumer demand.
• Apple market share increased to 52% in Q1 2023 from 49% in Q1 2022 as it began aggressively selling iPhone 11 in prepaid channels.
• Samsung Galaxy S23 shipments were up double digits YoY while the Galaxy A14 5G performed exceptionally well in prepaid resulting in 27% share of shipments.
• Lenovo Group (Motorola) and TCL Group saw shipments decline in Q1 but their overall shipment share grew as OEMs like Nokia HMD and white-label devices saw even steeper declines.
• During Q1 2023, carriers reported very low upgrades. We expect the incumbent postpaid players to increase promotional activity during the second half of the year to combat cable MVNOs, which saw higher net additions than the Big 3 during the quarter, a first for the US smartphone market.
US Smartphone Shipments Market Share (%)
| Brands | Q4 2021 | Q1 2022 | Q2 2022 | Q3 2022 | Q4 2022 | Q1 2023 |
|---|---|---|---|---|---|---|
| Apple | 60% | 49% | 45% | 50% | 57% | 52% |
| Samsung | 24% | 27% | 28% | 24% | 20% | 27% |
| Motorola | 9% | 10% | 9% | 6% | 6% | 8% |
| TCL | 2% | 3% | 7% | 4% | 3% | 2% |
| 2% | 2% | 1% | 4% | 6% | 2% | |
| Others | 4% | 9% | 10% | 12% | 9% | 8% |
**Ranking is according to the latest quarter.


