


| Global | Q3 2024 | Q4 2024 | Q1 2025 | Q2 2025 | Q3 2025 | Q4 2025 | Q1 2026 | Q2 2026 |
|---|---|---|---|---|---|---|---|---|
| Android | 80% | 74% | 76% | 79% | 79% | 72% | 73% | 75% |
| iOS | 16% | 22% | 19% | 17% | 17% | 24% | 22% | 20% |
| Harmony | 4% | 4% | 5% | 4% | 4% | 3% | 5% | 5% |
Market Highlights
- Global smartphone sales declined 11% YoY in Q2 2026, with the slowdown worsening from a 4% YoY decline in the previous quarter. The decline was steepest in the entry-level and mid-tier segments, particularly across emerging markets, resulting in shifts in OS share.
- iOS recorded its highest-ever June quarter share at 20%, supported by steady demand for the iPhone 17 series and the launch of the iPhone 17e. Price increases by competing brands further strengthened the iPhone's value proposition, while trade-in offers and financing programs helped drive upgrades.
- Android's sales share fell 4% YoY in Q2 2026 to 75%, as competition from iOS and HarmonyOS intensified. The Samsung Galaxy S26 series performed better than its predecessor, mitigating the overall decline in Android's share. Chinese Android OEMs are shifting their focus to higher-value devices and scaling back activity in the entry-level segment to navigate RAM shortages and rising costs.
- HarmonyOS accounted for 24% of China's smartphone sales during the quarter and 5% globally. Higher component sourcing from local OEMs helped keep the brand better insulated from rising component prices and enhanced its competitiveness. The Huawei Enjoy 90 Pro Max contributed significantly to sales, while older smartphone models continued to sustain demand.
iOS vs Android Quarterly Market Share for USA, China and India
US Market

| US Share | Q3 2024 | Q4 2024 | Q1 2025 | Q2 2025 | Q3 2025 | Q4 2025 | Q1 2026 | Q2 2026 |
|---|---|---|---|---|---|---|---|---|
| Android | 48% | 35% | 45% | 50% | 45% | 31% | 42% | 49% |
| iOS | 52% | 65% | 55% | 50% | 55% | 69% | 58% | 51% |
China Market
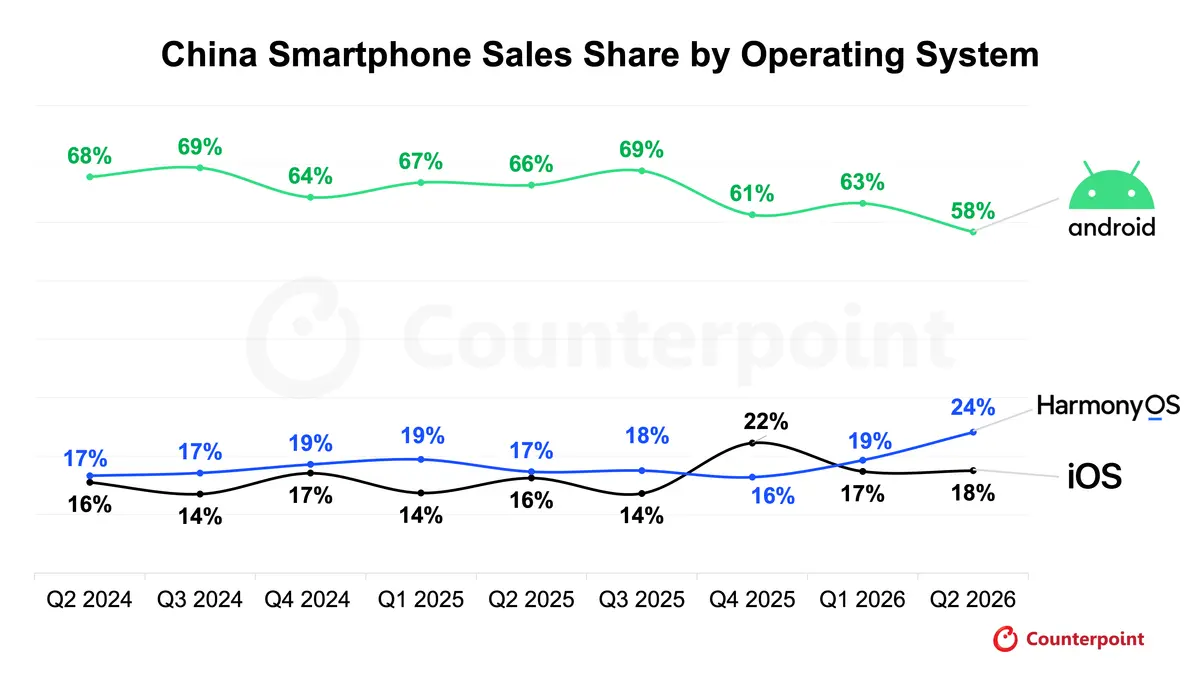
| China Share | Q3 2024 | Q4 2024 | Q1 2025 | Q2 2025 | Q3 2025 | Q4 2025 | Q1 2026 | Q2 2026 |
|---|---|---|---|---|---|---|---|---|
| Android | 69% | 64% | 67% | 66% | 69% | 61% | 63% | 58% |
| iOS | 14% | 17% | 14% | 16% | 14% | 22% | 17% | 18% |
| Harmony | 17% | 19% | 19% | 17% | 18% | 16% | 19% | 24% |
India Market

| India Share | Q3 2024 | Q4 2024 | Q1 2025 | Q2 2025 | Q3 2025 | Q4 2025 | Q1 2026 | Q2 2026 |
|---|---|---|---|---|---|---|---|---|
| Android | 95% | 89% | 92% | 94% | 92% | 90% | 90% | 91% |
| iOS | 5% | 11% | 8% | 6% | 8% | 10% | 10% | 9% |
This page presents quarterly insights into the worldwide smartphone OS scenario, featuring country-specific breakdowns for Android, iOS, and HarmonyOS, specifically focusing on the US, China, and India.
This data is a part of a series of reports which provide an insightful view of the changing trends in smartphone components and driving factors in the various price segments. It covers 99% of the global handset market with specification analysis.
For detailed insights on the data, please reach out to us at [email protected]. If you are a member of the press, please contact us at [email protected] for any media enquiries.


